The Performance Dashboard tab displays performance statistics graphically. You can adjust the colors and time ranges of the graphs from the toolbar.

Toolbar actions (from left to right) are:
-
Editor: Two selection lists that enable you to:
Reopen a previously opened editor (arranged under connections).
Start a new DB Notebook, SQL Script, TS Script, or JS Script editor.
Graph Colors: Select a color scheme. Optional values are
Classic,Light(default),Lively,Detectable,Trello,Brewing, andGray Tones.Time Range: Select 150 seconds (default), 5 minutes, or 10 minutes.
The following figure shows the layout of the information within the Performance Dashboard tab, which is divided into three areas: network status, MySQL status, and InnoDB status. Hover over the visual objects to see additional information, such as a total count.
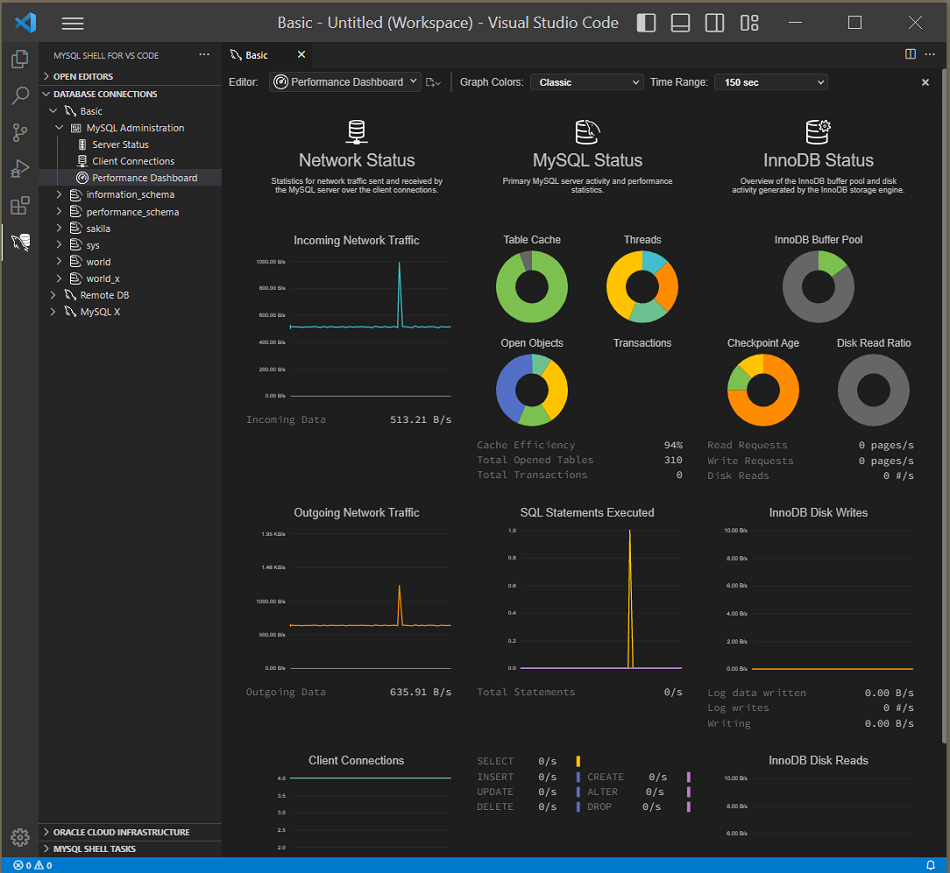
This status shows the basic statistics for network traffic sent and received by the MySQL server over client connections. Data points include the Incoming Network Traffic, Outgoing Network Traffic, and Client Connections.
This status shows the primary MySQL server activity and
performance statistics. Data points include the Cache
efficiency, Total Open Table ,
Total Transactions. In addition, the
SQL Statements Executed appears in a chart
format with counts (per second) for all statements and
individually for SELECT,
INSERT, UPDATE,
DELETE, CREATE,
ALTER, and DROP
statements.
This status provides an overview of the InnoDB buffer pool and disk activity that is generated by the InnoDB storage engine. It shows, graphically, the InnoDB buffer pool, checkpoint age, and disk read ratio.
Data points are separated into three groups:
-
General usage (below the visual objects)
Read Requests: The number of logical read requests (pages per second) InnoDB has performed to the buffer pool.Write Requests: The number of logical write requests (pages per second) InnoDB has performed to the buffer pool.Disk Reads: The number of logical reads (per second) that InnoDB could not satisfy from the buffer pool. As a result, these had to be read from the disk.
-
InnoDB Disk Writes
Hover over this dynamic chart to see the number of disk writes over a specific second. The available range includes the last 120 seconds.
Log Data Written: The number of writes written to the InnoDB redo log file.Log Writes: The number of physical writes written to the InnoDB redo log file.Writing: Total amount of data (in bytes) written using file operations by the InnoDB storage engine.
-
InnoDB Disk Reads
Hover over this dynamic chart to see the number of disk reads over a specific second. The available range includes the last 120 seconds.
Buffer Writes: The number of doublewrite operations that were performed.Reading: Total amount of data (in bytes) read in file operations by the InnoDB storage engine.