Thresholds are the predefined limits for Advisors. If the monitored value breaches the defined threshold, an event is generated and displayed on the Events page for the asset.
Advisor thresholds use a variety of different value types, depending on the monitored value. Some use percentages, such as percentage of maximum number of connections. Others use timed durations, such as the average statement execution time. It is also possible to check if specific configuration elements are present or correct.
The following thresholds, listed in order of severity, can be defined for most Advisors:
Notice: issues which do not affect the performance of the server, but can be used to indicate minor configuration problems.
Warning: issues which do not affect the performance of the server, but may indicate a problem and require investigation.
Critical: indicates a serious issue which is affecting or can soon affect the performance of the server. Such issues require immediate attention.
Emergency: indicates a serious problem with the server. The server is unusable or unresponsive and requires immediate attention.
Not all Advisors require threshold parameters, others do not have any parameters, such as the Graphing Advisors.
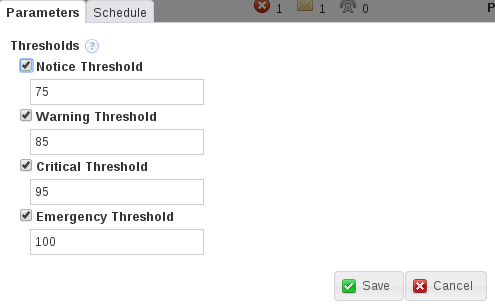
The following image shows an example of threshold definitions on the Parameters tab of an advisor:
The values shown are taken from the Availability Advisor, Maximum Connection Limit Nearing or Reached. The values define the percentage of maximum connections at which an event is logged. For example:
If the total number of connections is 75-84% of the maximum defined, a Notice event is displayed in the Events page.
If the total number of connections is 85-94% of the maximum defined, a Warning event is displayed in the Events page.
If the total number of connections is 95-99% of the maximum defined, a Critical event is displayed in the Events page.
If the total number of connections is 100% or more of the maximum defined, an Emergency event is displayed in the Events page.
The majority of the time-based thresholds use simple duration values, such as seconds, minutes and so on. These are used to monitor such values as system uptime and, if the value for uptime drops below a certain value, indicating a restart, trigger an event.
Others use an Exponential Moving Average Window, which monitors values over a predefined time period. One such advisor is the CPU Utilization Advisor. The moving average window is used because CPU utilization can spike many times a minute, for a variety of different reasons. Raising an event for each spike would not be useful. The moving average enables you to monitor CPUs for long durations and take an average CPU utilization across that duration. Thresholds are defined against that average.
Percentage-based thresholds trigger events based on percentages of a server-defined value. Maximum number of connections, for example, raises events based on a percentage value of the total number of connections to the monitored instance or group.
