MySQL Enterprise Monitor 8.0 Release Notes
The Agent Health Advisor monitors the monitoring agent's resource usage, communication status, backlog and memory usage.
The Agent Health Advisor configuration dialog is divided into the following functional areas:
The General section defines the CPU and RAM usage thresholds. These thresholds generate events if the defined threshold value is broken by either CPU or RAM usage. Both threshold definitions use a moving average window. Although it is possible to use very small values for a moving average window, large values, larger than seconds, are recommended.
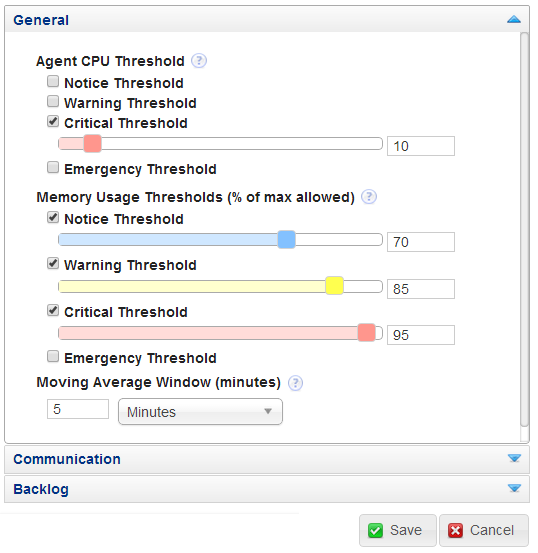
Agent CPU Threshold: enables you to define thresholds for percentage CPU usage. The default value is Critical at 10% usage.
Memory Usage Thresholds (% of max allowed): enables you to define thresholds for RAM usage as a percentage of the maximum heap size allocated to the monitoring agent. The default values are:
Notice = 70
Warning = 85
Critical = 90
The Communication section defines the thresholds for latency and HTTP errors between agent and MySQL Enterprise Service Manager.
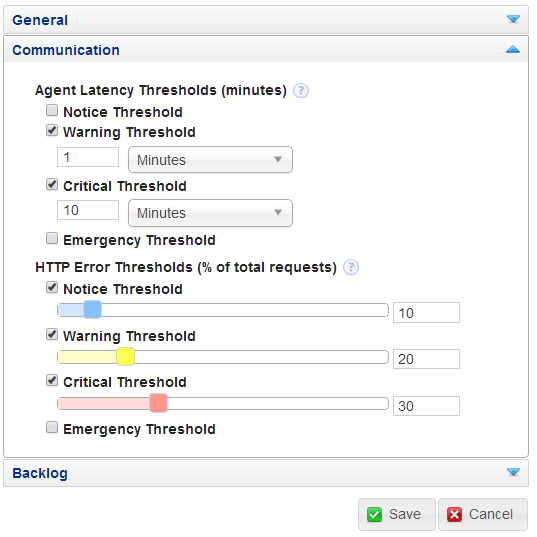
Agent Latency Thresholds: enables you to define thresholds for time difference between the time the data was collected and the time MySQL Enterprise Service Manager received the collected data. This can be caused by clocks that are not synchronized, network problems, and so on. The default values are:
Warning = 1 minute
Critical = 10 minutes
ImportantUnder certain circumstances, such as MySQL Enterprise Service Manager experiencing heavy load, events can be raised for Agent host time out of sync relative to dashboard. These can occur even though both MySQL Enterprise Service Manager and the monitored host are synchronized with the same time server and no time-synchronization problems exist.
The Agent Health Advisor compares the time on the MySQL Enterprise Service Manager against the time on the monitored host. If no time-synchronization issues exists, these false positive events are auto-closed.
HTTP Error Thresholds (% of total requests): enables you to define thresholds for number of HTTP errors as a percentage of the total number of HTTP requests. The default values are:
Notice = 10
Warning = 20
Critical = 30
If the monitoring agent is unable to communicate with the MySQL Enterprise Service Manager, it stores the collected data in memory up to a limit of 10MB, then on the filesystem, up to a limit of 10MB, giving a total limit of backlog storage of 20MB. If the limit is reached, backlog data is dropped.
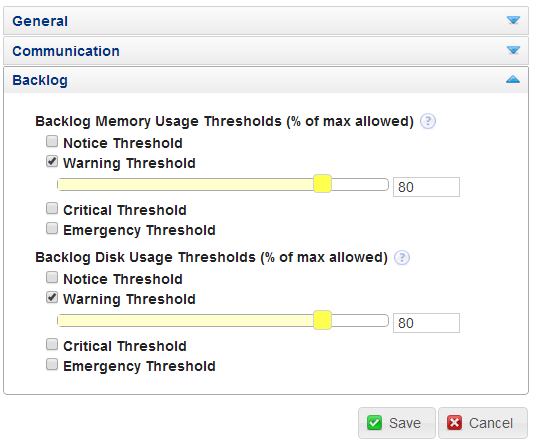
Backlog Memory Usage Thresholds (% of max allowed): enables you to define a threshold for the amount of RAM used by the backlog, as a percentage of the maximum RAM allowed, 10MB. The default value is Warning = 80, which corresponds to 8MB of RAM used.
Backlog Disk Usage Thresholds (% of max allowed): enables you to define a threshold for the amount of disk space used by the backlog, as a percentage of the maximum disk space allowed, 10MB. The default value is Warning = 80, which corresponds to 8MB of disk space used.