This section describes the Database File I/O reports and graphs.
This report requires sys schema be installed on the selected MySQL instance. If sys is not installed, and the selected instance is compatible, you are prompted to install it.
Each tab contains the following common elements:
Show n Entries: Number of entries to show per page.
Search: search the contents of the page.
Show/Hide Columns: enables you to change the column set displayed on the page by selecting or deselecting the columns.
Page Navigation: buttons enabling you to navigate the pages of the report.
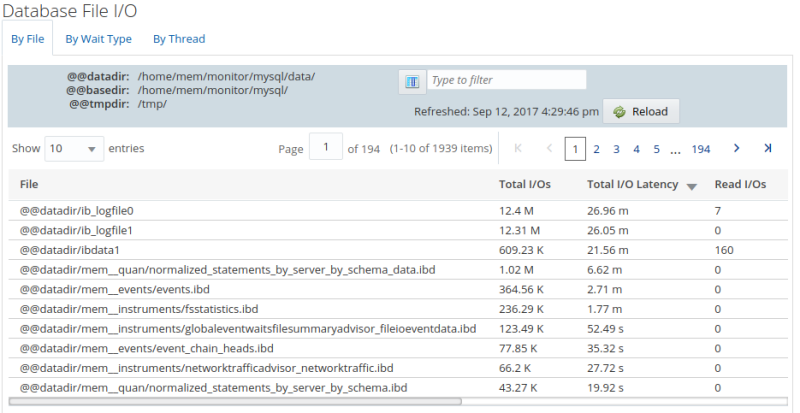
Shows the top global I/O consumers by latency, and by file. The
data is retrieved from
sys.x$io_global_by_file_by_latency, and
sorted by total latency by default.
For more information on the data retrieved in this report, see The io_global_by_file_by_latency and x$io_global_by_file_by_latency Views.
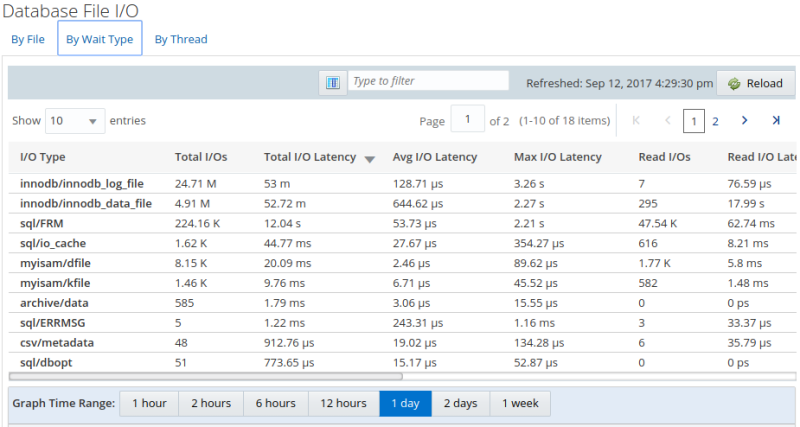
Shows the top global I/O consumers by latency. The data is
retrieved from
sys.x$io_global_by_wait_by_latency, and
sorted by total latency, by default.
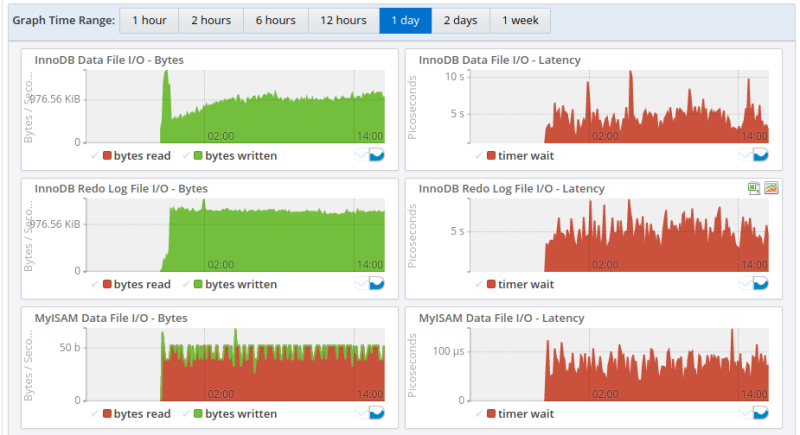
This report is a combination of report and graphs. The graphs can be redrawn based on a time range. To change the time range, select one of the range buttons. Values range from 1 hour to 1 week.
For more information on the data retrieved in this report, see The io_global_by_wait_by_latency and x$io_global_by_wait_by_latency Views.
The following shows a subset of the graphs available on the I/O By Wait Type tab:
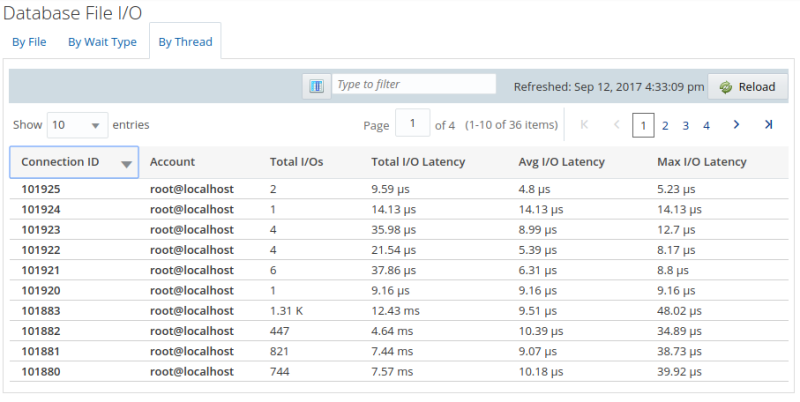
Shows the top I/O consumers by thread, ordered by total latency.
The data is retrieved from
sys.x$io_by_thread_by_latency, and sorted by
latency, by default.
For more information on the data retrieved in this report, see The io_by_thread_by_latency and x$io_by_thread_by_latency Views.


