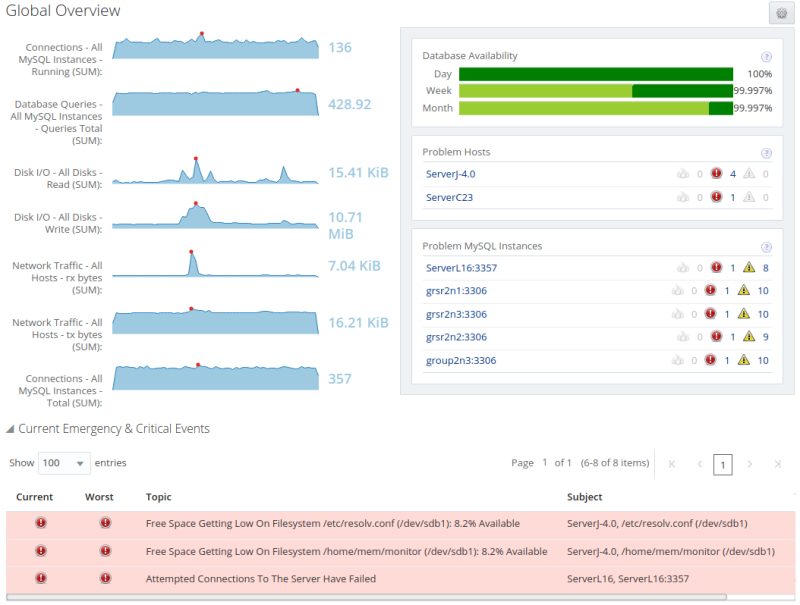
The Overview shows a high level summary of the MySQL clusters, groups, instances, and hosts monitored by MySQL Enterprise Monitor.
The Overview summarizes various key statistics related to the context selection, Database Availability, Problem Hosts, Problem MySQL Instances, and any current MySQL Instances or Hosts that have active Critical or Emergency level events against them. It is designed in this way to give you a quick high level picture of assets that require immediate attention, as well as give you an up to date profile of how MySQL Instances within environment are behaving.
The contents of the Overview depend on the selection made in the target selection menus at the top of the page. The following selections are possible:
Global Overview: default context selection of Global Summaries and All Targets. the overview displays a summary of all monitored assets.
Group Overview: (present only if you have created groups or are monitoring replication topologies) displays the overview of the group or topology selected from the Global Summaries menu. The information displayed relates to the contents of the selected group or replication topology, only.
MySQL InnoDB Cluster: (present only if you are monitoring InnoDB Cluster or Group Replication topologies) displays the overview of the InnoDB Cluster or Group Replication topology selected from the Global Summaries menu. The information displayed relates to the contents of the selected group or replication topology, only.
NoteGroup Replication topologies are included in the InnoDB Clusters section of the Global Summaries menu.
MySQL NDB Cluster Overview: (present only if you are monitoring MySQL NDB Clusters) displays the overview of the MySQL NDB Cluster selected from the Global Summaries menu. The information displayed relates to the contents of the NDB Cluster, only.
MySQL Instance Overview: displays the overview of the MySQL instance selected from the All Targets menu. The information displayed relates to the selected MySQL instance, only. Information on the instance's hostname, port, version, and directory paths is also displayed.
OS Host Overview: displays the overview of the host selected from the All Targets menu. The information displayed relates to the selected MySQL instance, only. Information on the filesystems and network interfaces is also displayed.
NDB API Node Overview: (present only if you are monitoring MySQL NDB Clusters) displays the overview of the NDB API node selected from the All Targets menu. The information displayed relates to the selected node, only.
NDB Data Node Overview: (present only if you are monitoring MySQL NDB Clusters) displays the overview of the NDB Data node selected from the All Targets menu. The information displayed relates to the selected node, only.
NDB Management Node Overview: (present only if you are monitoring MySQL NDB Clusters) displays the overview of the NDB API node selected from the All Targets menu. The information displayed relates to the selected node, only.
Agent Overview: displays the overview of MySQL Enterprise Monitor Agent selected from the All Targets menu. The information displayed relates to the selected agent, only. Information on the agent's host is also displayed.
