MySQL Workbench Release Notes
This section summarizes many of the new features added to MySQL Workbench 6.1, in relation to the MySQL Workbench 6.0 release.
The new PERFORMANCE section includes Dashboard, Performance Reports, and Performance Schema Setup pages. Generally, this new performance reporting feature provides a graphical representation of key statistics from the MySQL server status, and provides an overview of the MySQL server subsystems.
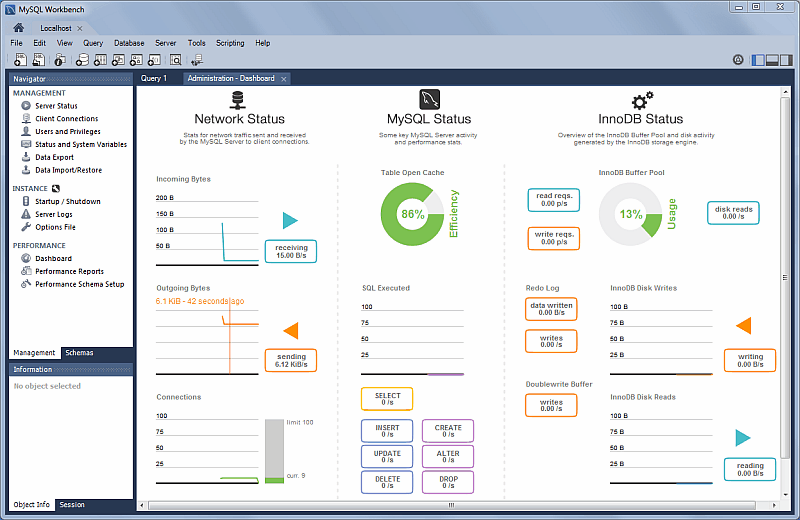
Dashboard
View server performance statistics in a graphical dashboard.
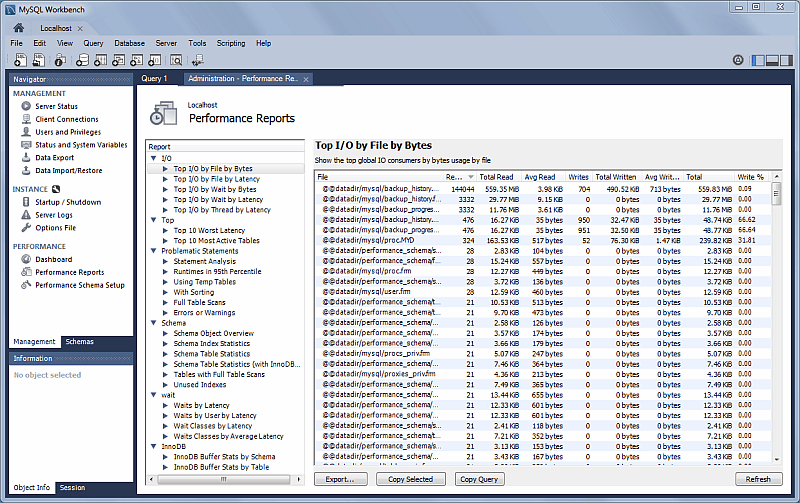
Performance Reports
Performance schema based reports that provide insight into the operation of the MySQL server through many high-level reports.
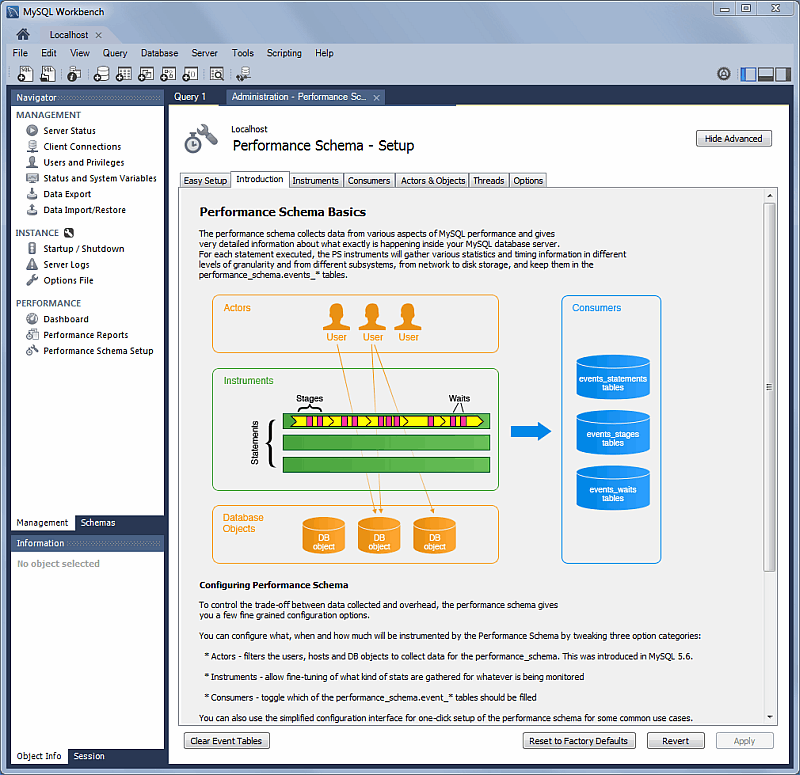
Performance Schema Setup
A GUI for configuring and fine tuning the Performance Schema instrumentation. Initially, this loads an "Easy Setup" page that is enough for most users. Slide the "Performance Schema Full Enabled" slider to YES to enable all available Performance Schema instruments.
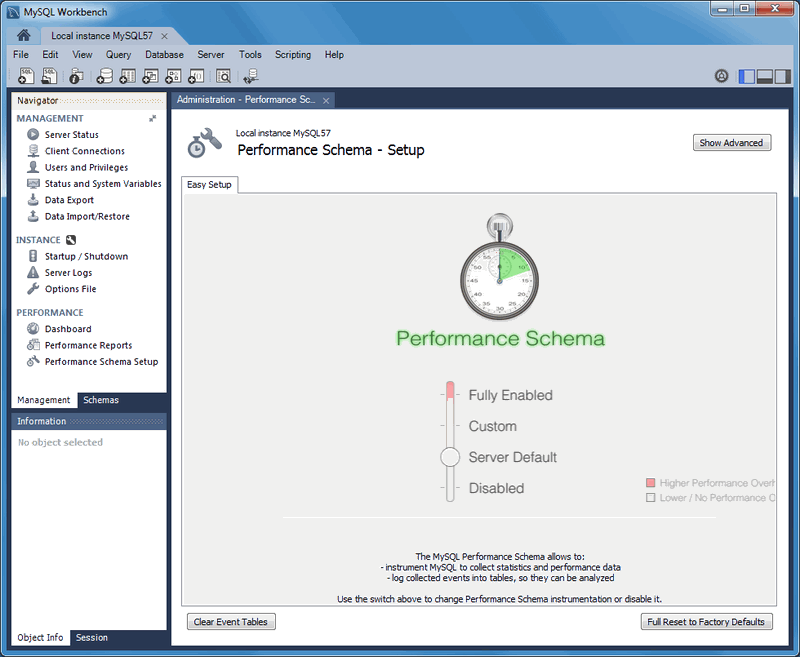
Clicking provides methods to fine tune the Performance Schema instrumentation.
For additional information, see Chapter 7, Performance Tools.
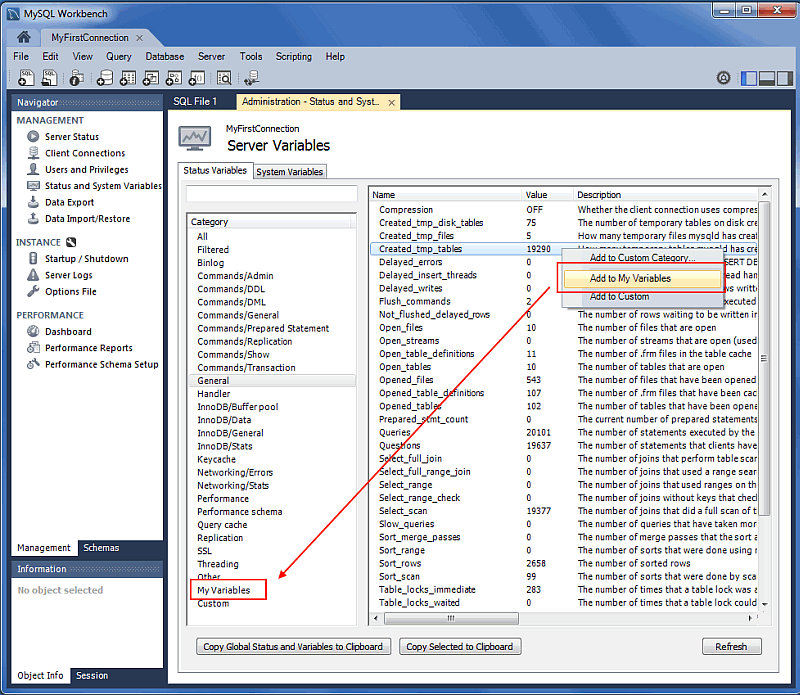
Variables can now be organized using custom groupings in the Status and System Variables Management tab.
To create a custom group, right-click on a variable and choose either (to create a new category), or an existing custom category. For additional information, see Section 6.4, “Status and System Variables”.
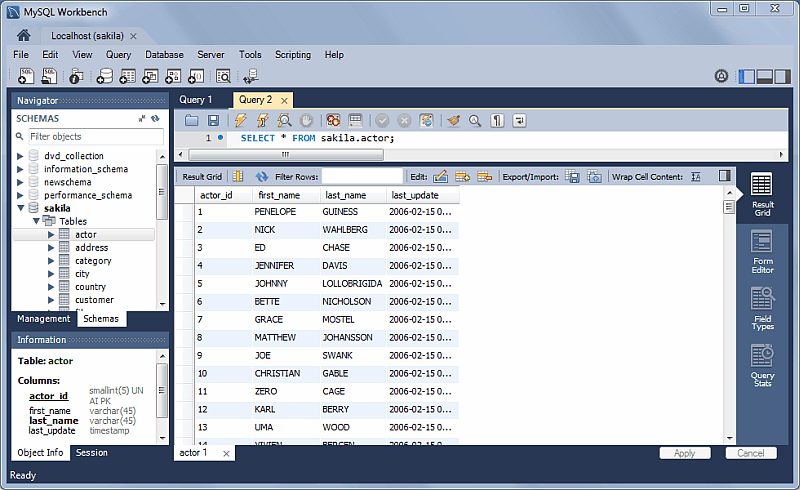
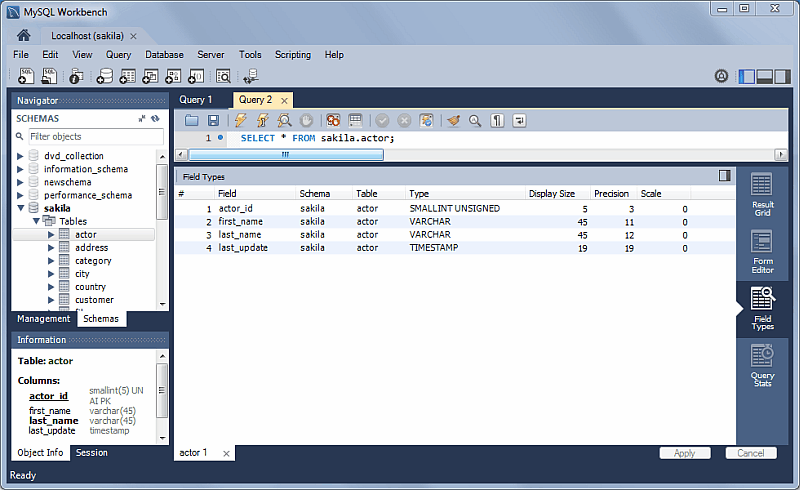
Additional viewing options were added for executed statements:
Result Grid
Available previously, and it remains the default view.
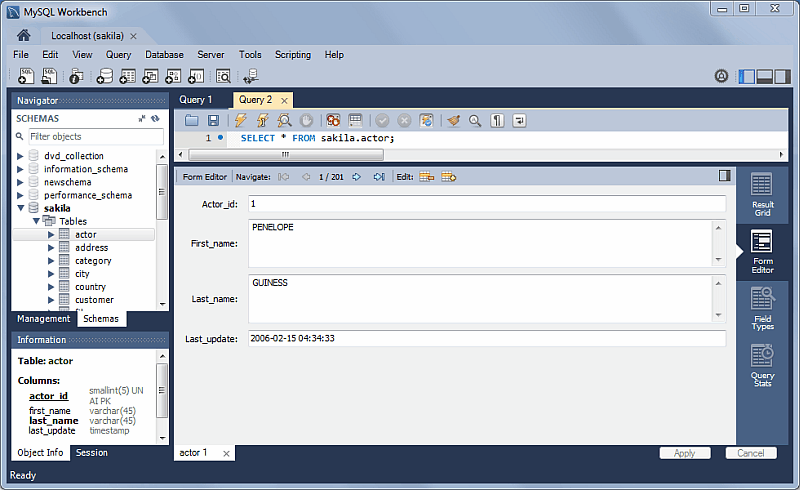
Form Editor
You can now edit records row by row in a form style editor.
Field Types
Displays information about the selected fields, similar to
passing in --column-type-info from the
command line client.
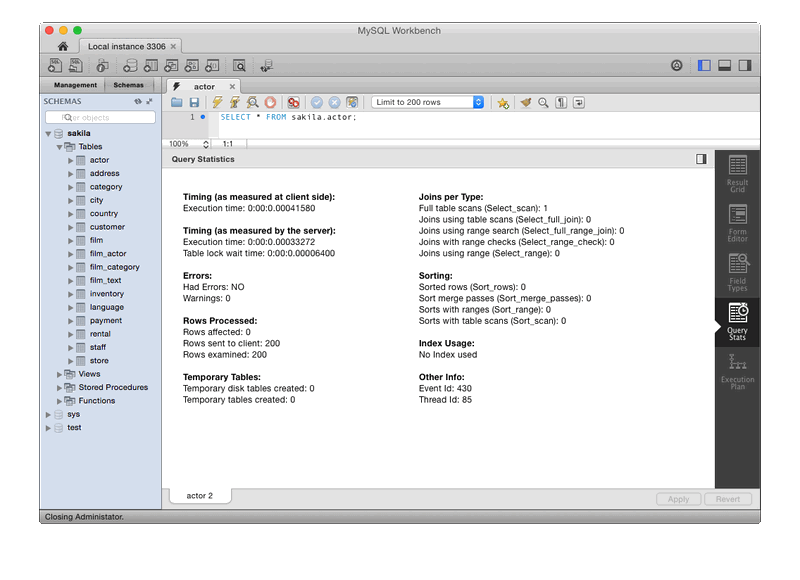
Query Stats
Query statistics are taken from the Performance Schema, and includes information about timing, temporary tables, indexes, joins, and more.
Several behavioral improvements were made to the MySQL Workbench home screen, including:
Connection tiles can now be repositioned by using drag and drop
A script or model file can be dragged into a MySQL connection tile
The following right-click options were added to the connection tiles: and
Right-clicking a blank area in the MySQL Connections area now offers an option to create a
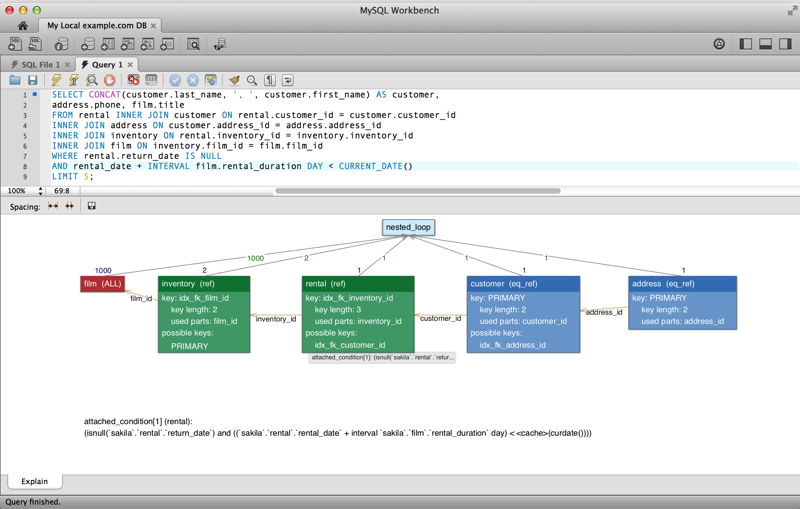
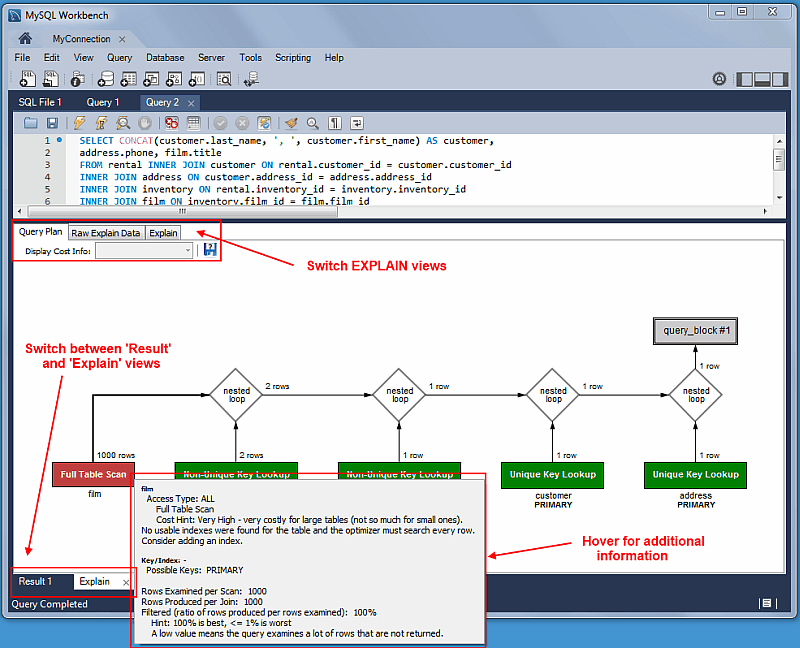
The layout changed, and additional information is now viewable
by hovering over the fields. It also displays traditional
EXPLAIN output in a separate tab, and the
Raw Explain Data (as JSON) in another.
For MySQL server 5.7+, the new "cost information" (such as
"query_cost" and "sort_cost) is also utilized.
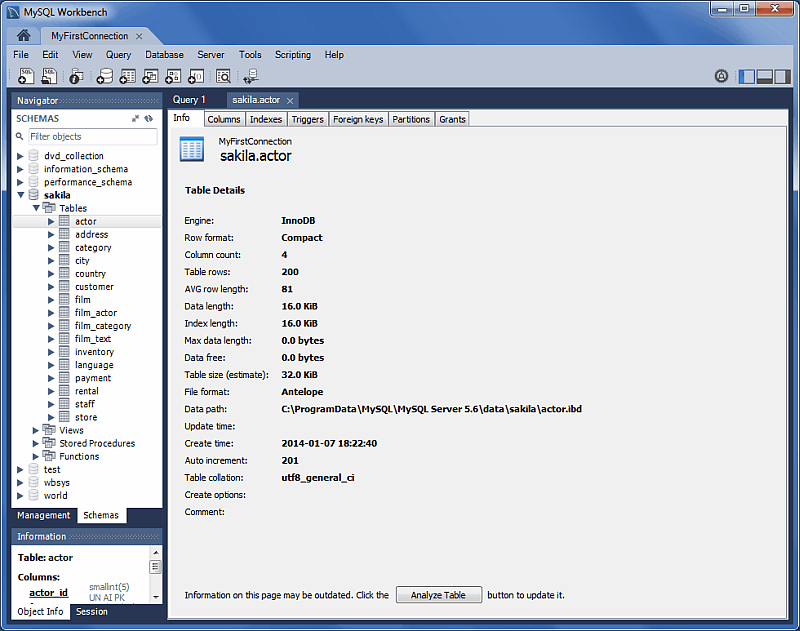
View table information, similar to the Schema Inspector. This also has a simpler and easier to use interface for analyzing and creating indexes for your tables.
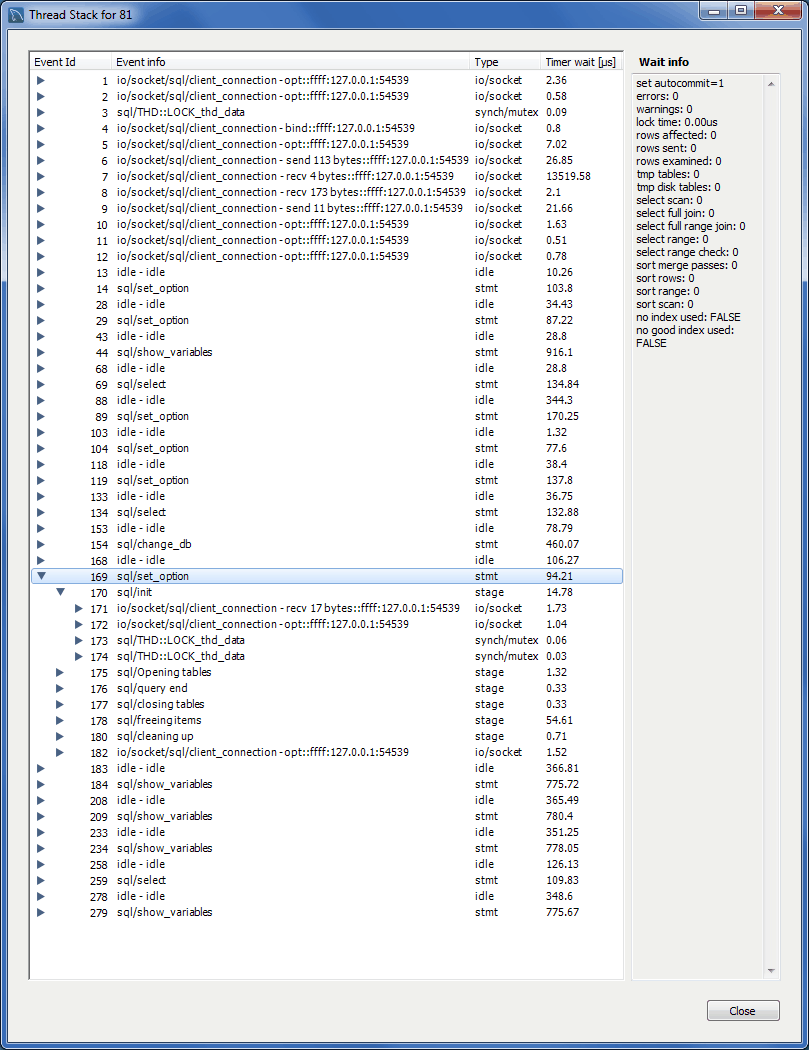
Additional information was added to the Client Connections tab, such as Thread ID, Parent Thread, Instrumented, and Type.
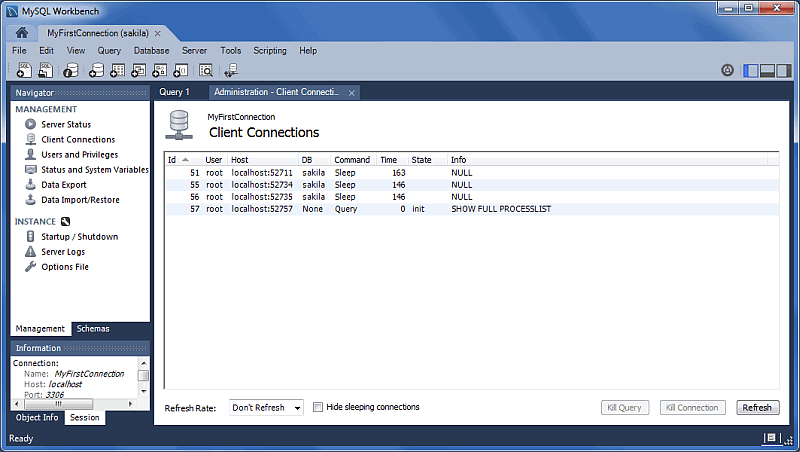
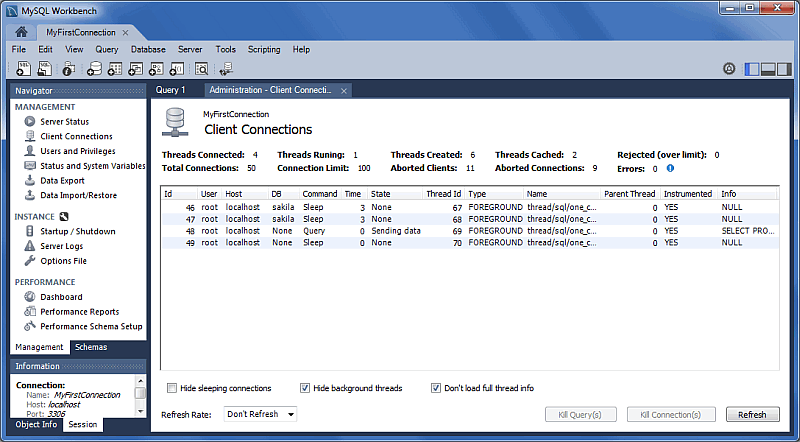
Also, a Thread Stack view option was added by right-clicking a connection entry in the Client Connections tab and choosing .