Great news: Group Replication is now officially released with MySQL 5.7.17, congratulations to everybody that worked so hard for it!
In this post I plan to share more details about the performance of Group Replication while addressing one of our frequently asked questions, which is how it performs compared to Galera. For other posts dedicated to Group Replication performance please visit this, this and this.
What follows is not a short post. Even if “brevity is the soul of wit” (from Hamlet), it’s hard to be brief when so many things ask for attention. Nevertheless, only the main charts are presented here. The remaining, for the more curious, are available in the summary charts file and in the results over time file.
Highlights
- The benefits from native built-in and automated High-Availability (HA) do come with some performance costs, but as you’ll see these costs are relatively low (and we’re already working on things to improve performance even further);
- Group Replication is closing in on asynchronous replication: 84% of the throughput on OLTP RW and above 60% on Update Indexed, even on groups with 9 members and durable settings on storage. On the same configuration Galera delivers 30% on OLTP RW (38% with non-durable settings) and 10% on Update Indexed (12,5% with non-durable settings);
- On Sysbench RW Group Replication delivers around 2.7x the throughput of Galera with 3 members (1.8x with non-durable settings) and up to 3x with 9 members (2.3X with non-durable settings). On Sysbench Update Index Group Replication delivers from 6.5x the throughput of Galera with 3 members (1.4x with non-durable settings) and up to 7.7x with 9 members (4.8x with non-durable settings).
1. Benchmarks
The performance evaluation presented here was done using Sysbench, specifically the OLTP Read/Write (RW) and the non-transactional Update Indexed Row benchmarks. Sysbench was chosen for this first comparison because it’s both a simple and well known set of benchmarks, and effective at uncovering performance problems in MySQL.
However, let me stress that to evaluate Group Replication one should use a real workload that would be deployed on it; what is presented next are the results of an artificial benchmark running on a particular hardware configuration, nothing more.
The tests were performed using MySQL 5.7.17 with Group Replication and Percona XtraDB Cluster 5.7.14-26.17, which contains a fork of Galera 3. These are the most recent GA versions based on MySQL 5.7 available at the time of this writing. Only MySQL 5.7 based servers were considered, and the InnoDB buffer pool was sized to fit in the 8M row database, to show mainly the effects of the replication technology.
With the focus on HA, in this post we present the single-primary, or single-master, benchmarks only. Note that multi-master is fully functional as long as these limitations explained here are considered.
We wanted to show how each replication technology scales with the number of nodes in the group, using a modern but common hardware configuration: 9 dual-socket, 2×10 core, servers with SSD and 10Gbps Ethernet network. A client server sends requests to a single server of the 3, 5, 7 and 9 groups members, group sizes that support the failure of 1, 2, 3 and 4 members, respectively.
The comparison includes tests with durability (innodb_flush_log_at_trx_commit=1, sync_binlog=1) and without (sync_binlog=0, innodb_flush_log_at_trx_commit=2) on local storage. It must be highlighted that using durable settings is less important in this context, as transactions can be made durable on the other members of the group, thus in some cases you can rely on network durability instead of local disk durability. However, while it is less likely, there is no guarantee that transactions will not be lost as the simultaneous failure of all members, particularly in the event of simultaneous power failures. This is the main reason we include both configurations, but also because it makes a considerable difference in Galera – so it’s better to show both. We also include performance schema in the durable configuration to be closer to real deployments.
Another issue that had to be included because of its impact on Galera is a range of different flow control settings (gcs.fc_limit=X on Galera and flow-control-certifier/applier-threshold=X on Group Replication), including with flow-control disabled. The numbers presented below consider the best value in any flow-control configuration except that with flow-control disabled.
2. Sysbench OLTP RW
The Sysbench OLTP RW benchmark subjects the database to read and write transactions, so it can be used to show the replication workload going to the replicas while the master is handling the read workload also (the write components consists of an insert, a delete and two updates).
2.1. Maximum sustained throughput and scalability
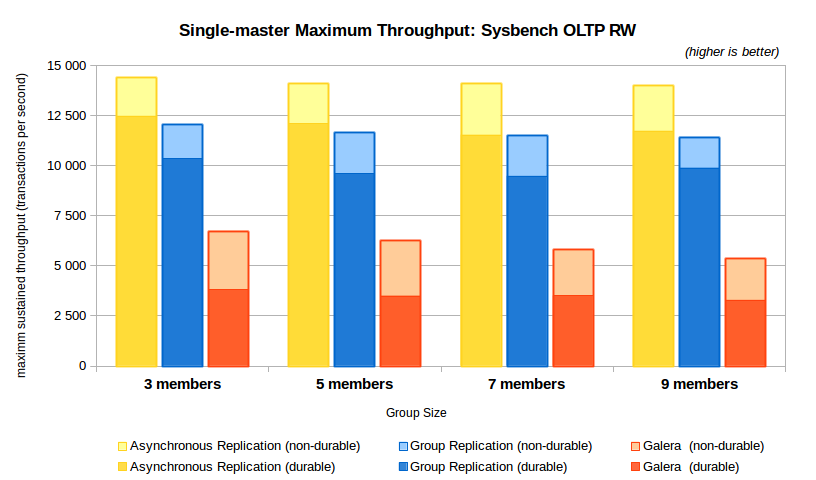
The following chart shows the maximum sustained throughput obtained by Sysbench OLTP RW in any of the tested client configurations. By sustained throughput we mean the one obtained without letting the replicas increase lag, so it shows the throughout that all group members can sustain over time (for more information check here).
The chart includes results with and without durability settings on the same bar, with the lighter colors representing the non-durable configurations.
Some observations:
- Group Replication delivers more than 80% of the throughput of asynchronous replication, while Galera goes to 46% (3 members) to 38% (9 members) of that when durability is off;
- The use of durability settings introduces a much larger overhead on Galera than it does on both asynchronous replication and Group Replication;
- The use of durability settings introduces little overhead on Group Replication and on asynchronous replication. On Galera the impact is much more noticeable, the achieving only 30% of asynchronous replication throughput when durability is used;
- On group replication and on asynchronous replication, throughput is
almost stable as the number of members grows up to 9 servers, which
makes scaling to large groups very effective; - Group Replication delivers around 2x the maximum throughput of Galera and around 3x when durability is used.
2.2 Throughput varying the number of clients
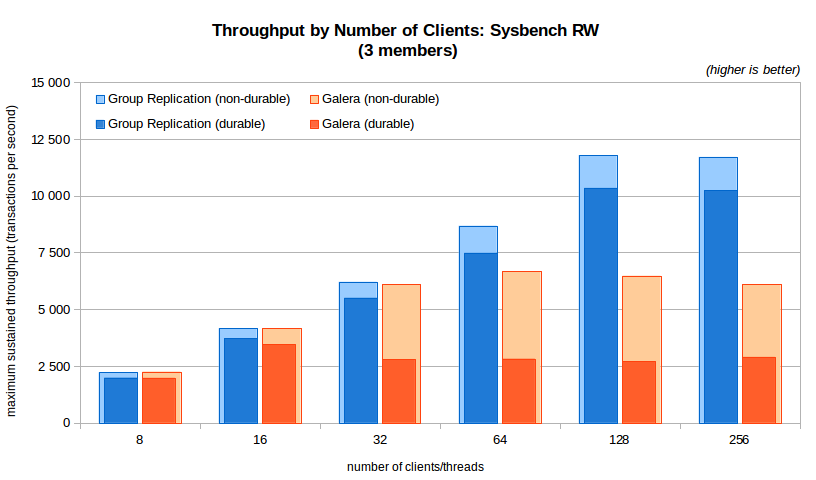
The next charts expands the previous one for Group Replication and Galera only, showing the results when varying the number of client threads. As before, both the durable and non-durable results are shown on the same chart. Only the 3 node chart is presented, the 5, 7 and 9 nodes versions are available in the summary charts.
- At the lowest concurrency levels Group Replication and Galera present similar results;
- As the number of clients goes beyond 16 (with durability) and 32 (without durability), the results from Galera become significantly lower than those from Group Replication;
- With durability on, Group Replication scales well until 128 clients (around 10,8K TPS, 9.9K TPS on 9 members); the highest Galera results in the 3 node configuration are achieved with 16 clients (around 3.8K TPS, 3.2K TPS on 9 members) and it becomes worse after that (this decrease does not happen with 5 nodes and more due to flow-control, check below);
- Without durability, Group Replication scales well to 128 and remains stable at 256 clients (at around 12,3K TPS, 11.4K TPS on 9 members), while Galera throughput increases only until 64 clients (just below 7K TPS, 5.4K TPS on 9 nodes).
2.3. Latency varying the number of clients
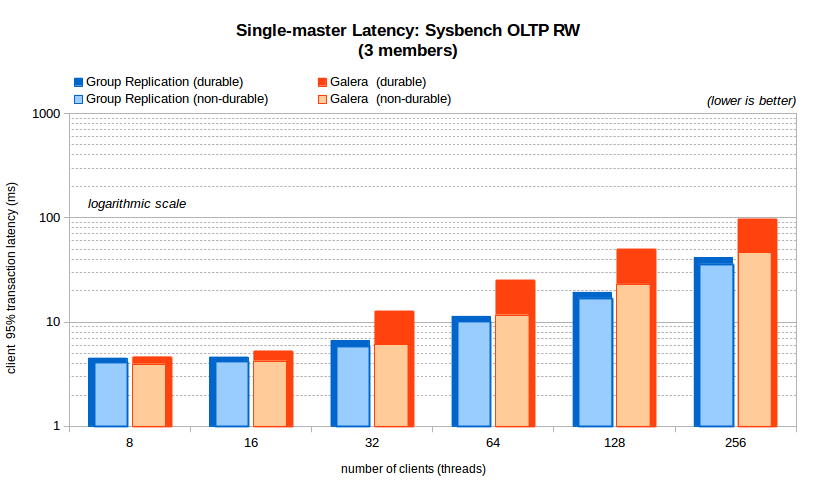
The next chart shows how the client transaction latency behaves in each case presented above. Please note that a logarithmic scale is used in this case to help show small and large numbers together without losing visibility of the details, at the cost of having very large differences becoming apparently smaller.
- The latency of Group Replication is considerably lower than Galera just after the lowest client counts;
- With durability on and after 32 clients, the latency in Group Replication becomes less than 50% that of Galera.
2.4. Stability over time
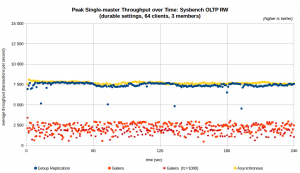
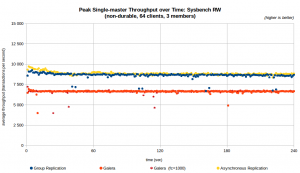
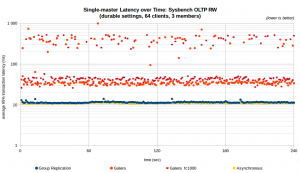
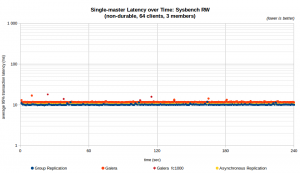
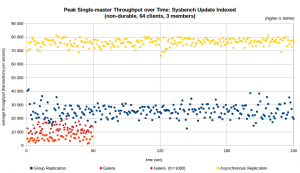
Another important aspect is how stable the throughput is over time. The next charts present the average peak throughput (so, the throughput returned to the Sysbench client, not the sustained throughput, averaged by runs) and latency throughout the execution of the benchmarks on 3 members. The Galera configurations include both the default flow-control settings and gcs.fc_limit =1000, as it makes a significant difference.
The stability of the server response becomes worse as the capacity of the system is reached. To assess that the number of clients is important, next chart shows the average of the runs on 64 clients but you can find charts for 32, 64 and 128 threads for 3, 5, 7 and 9 members in the results over time charts.
- The performance of Group Replication is stable over the duration of the tests with 64 clients (only a very small dip once a minute due to a cleanup task);
- Galera is also stable with 64 clients and 3 nodes when durability is off, with a few occasional dips; With durability on it presents very irregular throughput and latency, with many transactions having very high latency.
2.5. Throughput varying flow-control settings
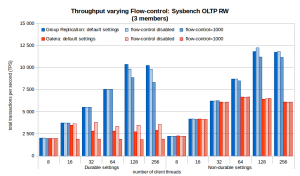
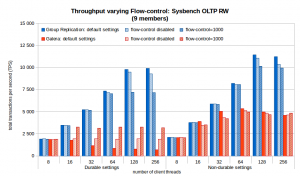
The flow-control effect mentioned above can be better seen on the following chart, which shows the throughput when the flow control thresholds are set to the default values, are set to 1000 (tested as improving throughput in Galera significantly in some cases) or are set to values that actually disable it. These charts are for 3 and 9 members, the remaining ones are in the summary charts.
Some observations:
- The default flow-control threshold has little impact on the sustained throughput of Group Replication, while using 1000 reduces throughput significantly – not to use;
- Disabling flow-control does not bring much benefit to sustained throughput, as the workload piles up along the replication pipeline and needs to go to disk;
- The best throughput of Galera with 3 nodes is when using the default setting, while with 9 nodes the default has very poor throughput when durability is on.
When durability is off, the effect of flow-control setting has reduced impact on Galera.
3. Sysbench Update Indexed Row
The Sysbench Update Indexed Row subjects the master to a write-only workload, with a single small auto-committed update having to go through the replication pipeline. Very small transactions are not the most efficient for replication, but they are a demanding test for both Group Replication and Galera (each small update will have to be one-by-one, sent to the group communication system, certified and applied in each slave). So they become useful to check what can be achieved in the hardest conditions.
3.1. Maximum sustained throughput and scalability
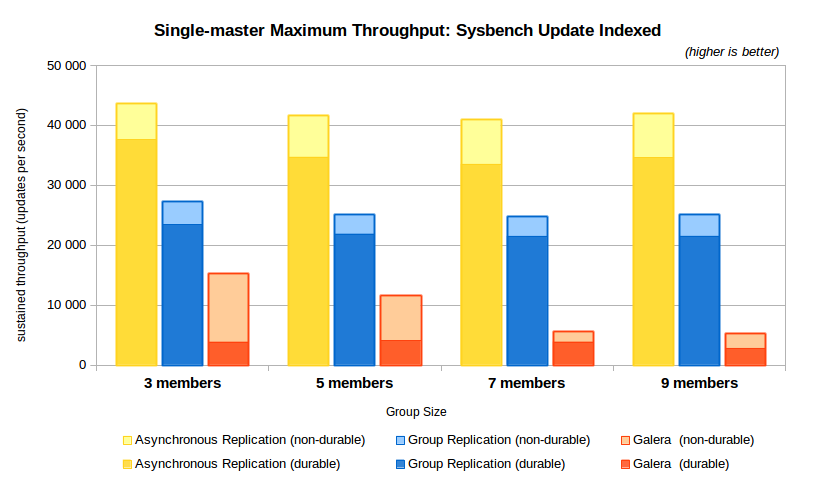
The following chart shows the maximum sustained throughput going through replication using any of the client configurations tested.
Some observations:
- The overhead from Group Replication is now larger than with Sysbench OLTP RW, with around 60% of the throughput from asynchronous replication;
- The overhead from Galera with durability off is also larger than before, now it achieves at best around 35% of asynchronous replication; and it diminishes a lot when then number of servers grows (down to only 12,5% with 9 members);
- When durability is on, however, the difference in Galera is dramatic: it goes from 10% of the throughput of asynchronous replication to 8% with 9 members; even with simpler transactions, Galera does not improve the number of operations compared to OLTP RW;
- Group Replication delivers around 1.8X (3 members) up to 2.3X (9 members) the throughput of Galera when durability is off and around 3X when durability is on.
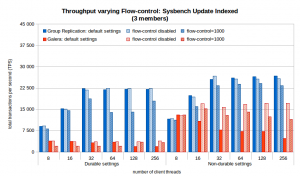
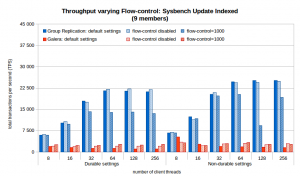
3.2 Throughput varying the number of clients
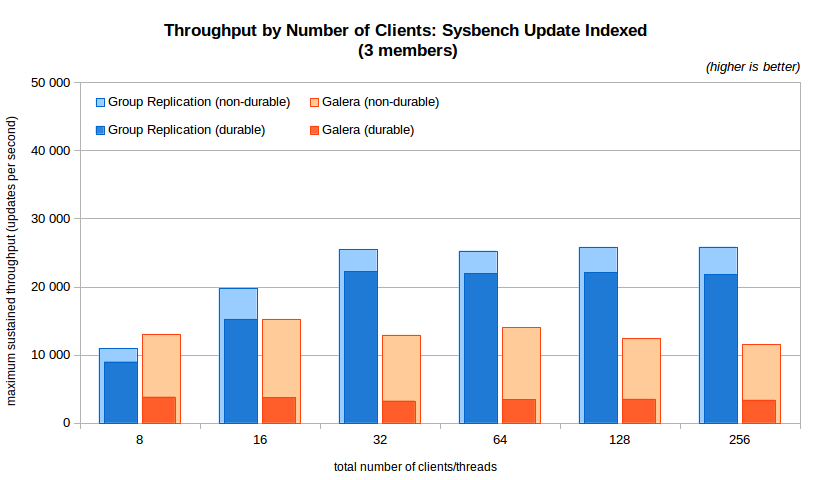
The next chart shows the results when varying the number of client threads for the Sysbench Update Index benchmark. As before, both the durable and non-durable results are shown in the chart. The 3 node chart is presented, the 5, 7 and 9 nodes versions are available in the summary charts file.
- The throughput for Group Replication grows up to 32 clients but then it becomes stable at around 22K updates/s for durable and 26K updates/s for non-durable;
- The throughput for Galera tops out at less then 16K updates/s at 16 threads, but then decreases slightly with the number of clients; when durability is on, however, it tops out immediately at around 4K with 8 threads;
- Group Replication delivers from 1.4x the throughput of Galera (up to 6.5x with durability) on 3 members, up to 4.8x on 9 nodes (7.7x with durability).
3.3. Latency varying the number of clients
The next chart shows how the client transaction latency behaves in each case with the smaller transactions.
- As expected from the throughput chart, the latency in Galera is much larger than that of Group Replication (only smaller on 8 threads, then from 1.3x to 8.5x times larger, remember the logarithmic scale).
- Again, the difference when durability is on is much larger (from 2.4x to 24x times larger).
3.4. Stability over time
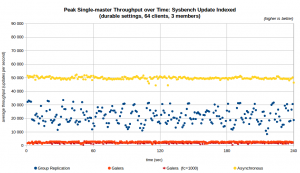
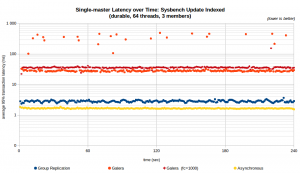
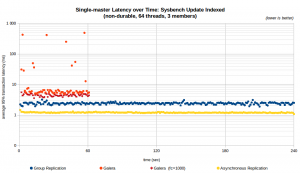
The next charts presents how stable the throughput and latency are over time using the single update transactions. As mentioned before, once the capacity of the server is reached it becomes harder to deliver stable throughput, particularly in this case where the replicas are unable to keep up and the flow-control must hold back the writes. In the results over time file you will find charts for 32, 64 and 128 threads for 3, 5, 7 and 9 members.
- With durability on the throughput of Galera is stable, unlike Group Replication; however, Galera is stable at less than 4K updates per second, while Group Replication oscillates 10K around an average of 22K updates per second average;
- The transaction’s latency varies less but still varies, as the flow control adjusts the throughput, but its value is an order of magnitude less then Galera in this configuration;
- When durability is off, the oscillation diminishes for Group Replication and increases for Galera, as the throughput also increases significantly; nevertheless, it tops at around 16K updates per second, while Group Replication goes up to 26K updates per second;
- You may notice that the data for Galera in the non-durable configuration ends at 1 minute; the reason for this is that once the number of threads grows after 32 threads on Sysbench Update Index without durability the Percona XtraDB Cluster dead-locks frequently and needs to be restarted. That is a bug that will surely be solved soon, but in order to keep on testing, we decided that when deadlocks appear we repeat the same tests but use only 1 minute in each run (in some cases 30 seconds was needed).
3.5. Throughput varying flow-control settings
We show again the flow-control effect on the following chart, now for the Sysbench Update Index benchmark. These charts are for 3 and 9 members, the remaining ones are in the summary charts file.
- The default flow-control threshold for Galera is not the best for the tested configuration, as was shown before, in all configurations using 1000 delivered better throughput;
- With a large number of updates per second (more than 20K/s) using the 1000 value for the flow-control threshold takes a toll on Group Replication throughput, unless strictly needed small values should be avoided.
4. Conclusion
Group Replication, now GA on MySQL 5.7.17, seems to provide good reasons to use it, with stable throughput and latency even on the most demanding workloads.
But the best tests are the ones we do ourselves, so we look forward to community testing and feedback.
ANNEX: Benchmarking details
Configuration files: <common durable> and <common non-durable>, <Group Replication specific> and <Galera specific>.
Methodology: The databases used had 8 million rows in 8 tables and each benchmark configuration was run at least two times during 4 minutes, on different occasions, and when the standard deviation was large additional runs were added.
Benchmark: Sysbench 0.5, https://launchpad.net/sysbench
Operating system: Oracle Enterprise Linux 7, kernel 3.8.13-118.13.3.el7uek.x86_64
Server hardware configuration:
- Oracle Server X5-2L machines with two Intel Xeon E5-2660-v3 processors (total of 20-cores, 40 hw threads);
- 3, 5, 7 and 9 server machines in the replication group;
- database and binary log placed on enterprise SSDs;
- all interconnected by a 10Gbps Ethernet network.
Client hardware configuration:
- One Oracle Server X5-2L machine with two Intel Xeon E5-2699-v3 processors (total of 36-cores) acting as a client;
- Connected to the servers using a 10Gbps Ethernet network.
