Performance Schema is used extensively both internally and within the MySQL community, and I expect even more usage with the new SYS Schema and the Performance Schema enhancements in 5.7. Performance Schema is the single best tool available for monitoring MySQL Server internals and execution details at a lower level. Having said that, we are also no stranger to the fact that any monitoring tool comes with an additional cost to performance. Hence It has always been an important question to find out just how much it costs us when Performance Schema is turned ON and to see what we can do to make it perform as fast as possible.
I have been using MySQL Performance Schema for the past year. This is my first blog on Performance Schema and here I am primarily concerned with the performance impact and characteristics around the default values.
Performance Schema Default ON vs OFF
The question I will try and answer here is this: How well does MySQL scale with performance_schema=ON (default parameters and configuration) compared to performance_schema=OFF?
Test Details
I used Sysbench to get TPS benchmarks. Just to ensure that I have some variation in my tests I ran Sysbench in both the CPU bound and the Disk bound environments to gather the stats. All tests were performed on the same server and with the same MySQL Server build. I used the latest development release (at the time), 5.7.6-m16, for my tests. With MySQL 5.7.6, 311 instruments are enabled by default.
Test Results
I was very happy to see the answers after the tests ran! They clearly show that the numbers are quite reasonable (within 1% – 3%) if we consider the huge benefits offered by Performance Schema with the default settings. More Details below:
CPU Bound
Sysbench Read Only Mode
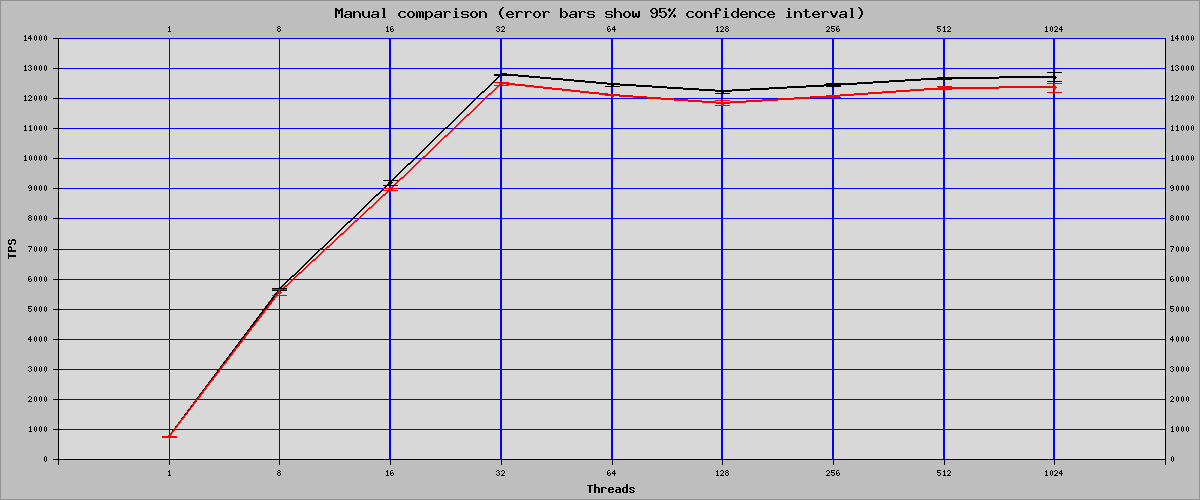
| Threads | OFF | ON | Percent Of Change |
| 1 | 754.42 | 750.47 | -0.52% |
| 8 | 5663.33 | 5542.28 | -2.14% |
| 16 | 9195.28 | 8976.31 | -2.38% |
| 32 | 12797.86 | 12490.66 | -2.40% |
| 64 | 12455.2 | 12117.88 | -2.71% |
| 128 | 12229.43 | 11852.55 | -3.08% |
| 256 | 12451.55 | 12077.16 | -3.01% |
| 512 | 12681.43 | 12350.65 | -2.61% |
| 1024 | 12717.92 | 12361.66 | -2.80% |
Sysbench Read Write Mode
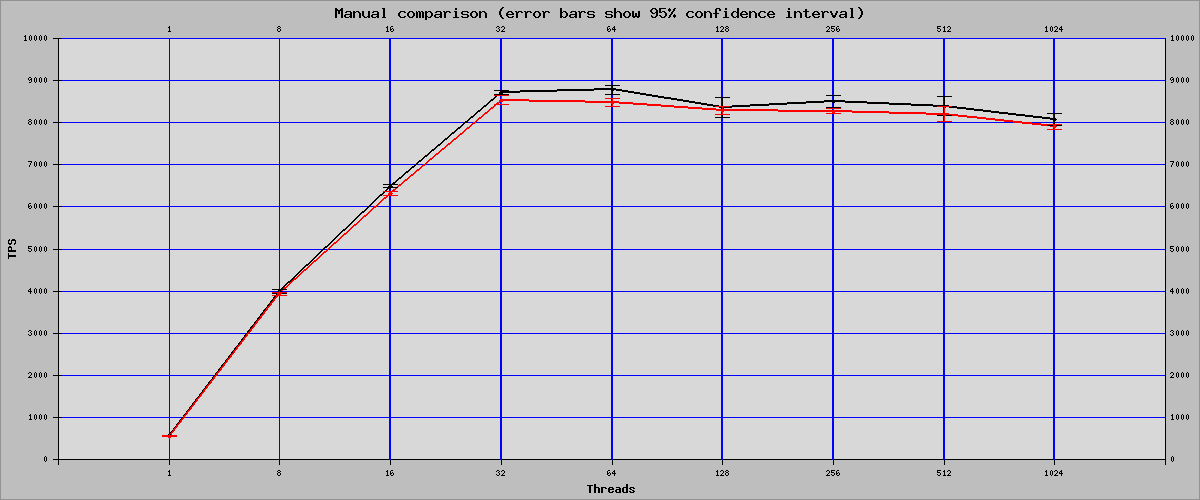
| Threads | OFF | ON | Percent Of Change |
| 1 | 567.81 | 554.59 | -2.33% |
| 8 | 3989.29 | 3937.59 | -1.30% |
| 16 | 6495.95 | 6325.28 | -2.63% |
| 32 | 8718.39 | 8528.89 | -2.17% |
| 64 | 8777.19 | 8470.87 | -3.49% |
| 128 | 8367.69 | 8287.51 | -0.96% |
| 256 | 8506.86 | 8271.87 | -2.76% |
| 512 | 8395.93 | 8202.53 | -2.30% |
| 1024 | 8078.42 | 7901.9 | -2.19% |
Disk Bound
Sysbench Read Only Mode
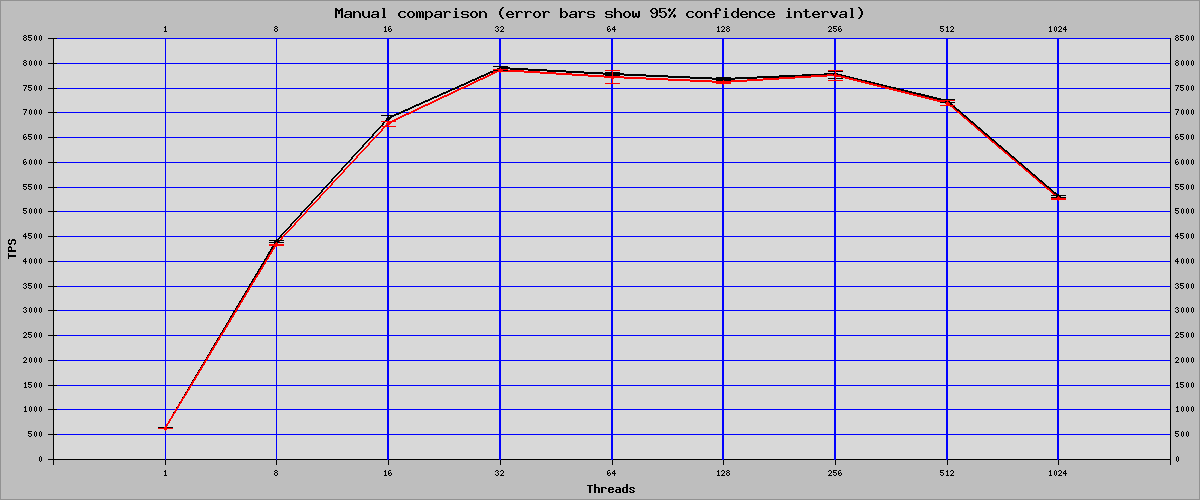
| Threads | OFF | ON | Percent Of Change |
| 1 | 633.1 | 624.68 | -1.33 |
| 8 | 4395.45 | 4332.14 | -1.44 |
| 16 | 6889.67 | 6774.17 | -1.68 |
| 32 | 7899.11 | 7847.52 | -0.65 |
| 64 | 7779.39 | 7721.26 | -0.75 |
| 128 | 7674.51 | 7611.16 | -0.83 |
| 256 | 7764.23 | 7752.19 | -0.16 |
| 512 | 7233.22 | 7190.7 | -0.59 |
| 1024 | 5313.35 | 5266.08 | -0.89 |
Sysbench Read Write Mode
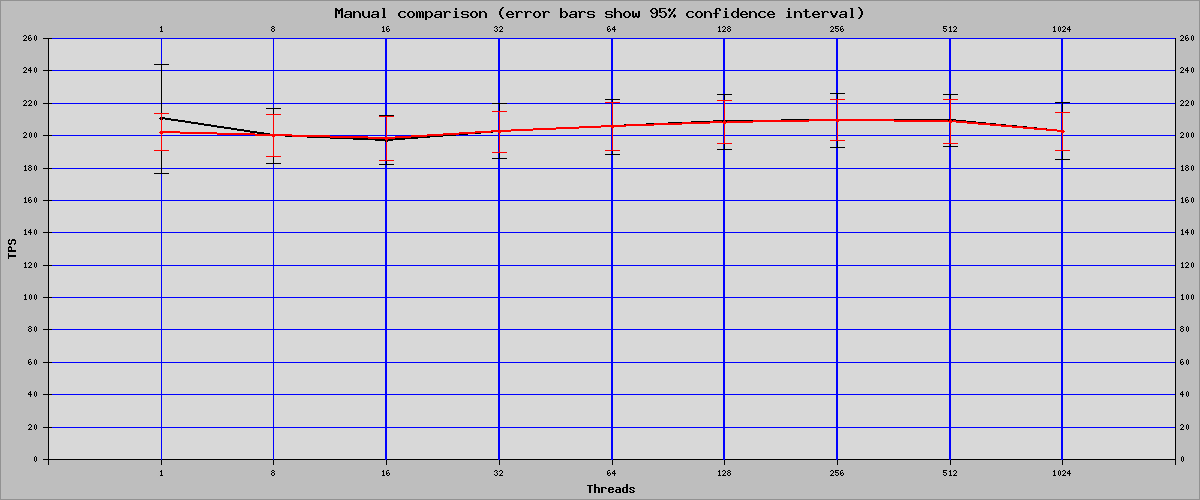
- performance_schema=ON shows a dip of 0.45%
| Threads | OFF | ON | Percent Of Change |
| 1 | 210.36 | 202.17 | -3.89% |
| 8 | 200.02 | 200.17 | 0.07% |
| 16 | 197.27 | 198.07 | 0.41% |
| 32 | 202.76 | 202.39 | -0.18% |
| 64 | 205.4 | 205.63 | 0.11% |
| 128 | 208.55 | 208.41 | -0.07% |
| 256 | 209.41 | 209.64 | 0.11% |
| 512 | 209.21 | 208.91 | -0.14% |
| 1024 | 202.81 | 202.67 | -0.07% |
Conclusion
In my tests we see average overhead results of:
- Just over 2% in the CPU Bound OLTP RW (2.23%) and OLTP_RO (2.40%) runs
- Less than 1% in the Disk Bound OLTP RW (0.41%) and OLTP_RO (0.92%) runs
Overall, as we see I think you can expect a performance impact of approximately 1-3% with performance_schema=ON vs OFF (again, using the default configuration). The most important takeaway is that while there are still some dips in raw performance numbers—which is expected—the overall impact is relatively small. We will also continue to do all that we can to lower the overhead and performance impact of Performance Schema even further in the future! I hope that these benchmarks may help anyone looking forward to using Performance Schema extensively, but are concerned about what performance impact may come with it.
As I’ve demonstrated here—due to all of the helpful input from the MySQL Community, and the work that we’ve done to lower the related impact and overhead—the Performance Schema can truly be said to offer great power, and do so without great cost!
That’s all for now. Thank you for using MySQL!
Appendix: Test Details.
| Instrument category | Count |
| statement/sql% | 139 |
| memory/performance_schema% | 70 |
| wait/io% | 48 |
| statement/com% | 32 |
| statement/sp% | 16 |
| statement/abstract% | 3 |
| wait/lock% | 1 |
| idle | 1 |
| statement/scheduler% | 1 |
| Product | MySQL |
| Version | 5.7.6-m16 |
| Location | https://dev.mysql.com/downloads/mysql/5.7.html Development Releases |
| OS | Linux |
| Memory | 128 GB |
| CPU | 32 x intel(r) xeon(r) cpu e5-2690 0 @ 2.90ghz |
| Arch | x86_64 |
| OS Version | oracle linux server release 7.0 |
Table4: Sysbench Configuration Details
| Version | 4.13 |
| Tests | sysbench oltp-ro , sysbench oltp-rw |
| Engine | Innodb |
| Thread Count | 1,8,16,32,64,128,256,512,1024 |
| DB Size | 10000000 rows in single table |
| Duration | 300 Seconds |
| Warmup Time | check table for warmup |
| Iteration | 3 |
Table5: MySQLD Configuration Details
| MySQLd Parameter | Disk Bound | CPU Bound |
| back_log | 1500 | 1500 |
| disable-log-bin | TRUE | TRUE |
| innodb_adaptive_flushing | 1 | 1 |
| innodb_buffer_pool_instances | 8 | 8 |
| innodb_buffer_pool_size | 340M | 16384M |
| innodb_checksums | 0 | 0 |
| innodb_data_file_path | ibdata1:2000M:autoextend | ibdata1:2000M:autoextend |
| innodb_doublewrite | 0 | 0 |
| innodb_file_per_table | 1 | 1 |
| innodb_flush_log_at_trx_commit | 2 | 2 |
| innodb_flush_neighbors | 0 | 0 |
| innodb_io_capacity | 1000 | 1000 |
| innodb_log_buffer_size | 64M | 64M |
| innodb_log_files_in_group | 3 | 3 |
| innodb_log_file_size | 2048M | 2048M |
| innodb_max_dirty_pages_pct | 50 | 50 |
| innodb_monitor_enable | ‘%’ | ‘%’ |
| innodb_open_files | 4000 | 4000 |
| innodb_purge_threads | 1 | 1 |
| innodb_read_io_threads | 16 | 16 |
| innodb_spin_wait_delay | 24 | 24 |
| innodb_stats_persistent | 1 | 1 |
| innodb_support_xa | 0 | 0 |
| innodb_thread_concurrency | 0 | 0 |
| innodb_use_native_aio | 0 | 0 |
| innodb_write_io_threads | 16 | 16 |
| join_buffer_size | 32K | 32K |
| key_buffer_size | 200M | 200M |
| loose-local-infile | 1 | 1 |
| low_priority_updates | 1 | 1 |
| max_allowed_packet | 1048576 | 1048576 |
| max_connections | 4000 | 4000 |
| max_connect_errors | 50 | 50 |
| port | 3306 | 3306 |
| query-cache-size | 0 | 0 |
| query-cache-type | 0 | 0 |
| sort_buffer_size | 2097152 | 2097152 |
| sql-mode | NO_ENGINE_SUBSTITUTION | NO_ENGINE_SUBSTITUTION |
| table_open_cache | 2048 | 2048 |
| table_open_cache_instances | 10 | 10 |
| transaction_isolation | REPEATABLE-READ | REPEATABLE-READ |
| user | root | root |