 You may have read Bernd’s recent post that explained how to try out some new beta functionality for MySQL Cluster and wondered what kind of use you could put the new ndb$info to. ndb$info uses tables/views to give real-time access to a whole host of information that helps you monitor and tune your MySQL Cluster deployment. This article gives one example, extending MySQL Enterprise Monitor to keep an eye on the amount of free memory on the data nodes and then raise an alarm when it starts to run low – even generating SNMP traps if that’s what you need.
One of the features of MySQL Enterprise Monitor is that you can define custom data collectors and that those data collectors can run SQL queries to get the data. The information retrieved by those custom data collectors can then be used with rules that the user defines through the MySQL Enterprise Monitor GUI to create warning/alarms.
In this example, I create two new data collectors and store the files in the “<MySQL Enterprise Monitor installation directory>/agent/share/mysql-proxy/items/” directory before starting up the MySQL Enterprise Monitor agents:
cluster_max_used.xml:
|
1
2
3
4
5
6
7
8
9
10
|
<span style="color: #800000;"><?xml version="1.0" encoding="utf-8"?> <classes> <class> <namespace>mysql</namespace> <classname>cluster_max_used</classname> <query><![CDATA[SELECT MAX(used) as Used FROM ndbinfo.memoryusage WHERE DATA_MEMORY = 'DATA_MEMORY']]> </query> </class> </classes></span> |
cluster_min_avail.xml:
|
1
2
3
4
5
6
7
8
9
10
|
<span style="color: #800000;"><?xml version="1.0" encoding="utf-8"?></span><span style="color: #800000;"> <classes> </span><span style="color: #800000;"> <class> </span><span style="color: #800000;"> <namespace>mysql</namespace> <classname>cluster_min_avail</classname> <query><![CDATA[SELECT MIN(max)as Max FROM ndbinfo.memoryusage WHERE DATA_MEMORY = 'DATA_MEMORY']]> </query> </class> </classes></span> |
In MySQL Enterprise Monitor, rules are grouped together into Advisors and so I create a new Advisor called “MySQL Cluster” and then create just one new rule within that Advisor group.
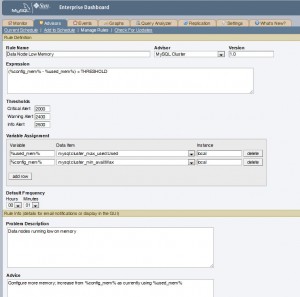
As shown in Fig. 1 the rule is called “Data Node Low Memory”. The “Variable Assignment” section is used to define 2 variables %used_mem% and %config_mem% which are populated from the Used and Max results from the 2 new data collectors. The “Expression” section is used to test “(Max – Used) < THRESHOLD” and then the values to be substituted for THRESHOLD are defined in the “Thresholds” section – indicating at what points the Info, Warning and Critical Alters should be raised.
There are then a number of optional sections that you can use to add useful information to the person investigating the alert.
Once the rule has been created, the next step is to schedule it and (if desired) tag that the alerts should also result in SNMP traps being raised. This is standard MySQL Enterprise Monitor practice and so it isn’t explained here except to point out that this rule is monitoring information from the data nodes but the rule has to be applied to a MySQL Server (MySQL Enterprise Monitor has no idea what a data node is) and so you need to schedule the rule against one or more arbitrary MySQL Server instances in the Cluster.

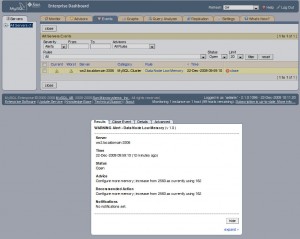
To test the functionality, start adding more data to your MySQL Cluster until the Warning alert is triggered as shown in Fig. 2. As you can see, the optional information we included is shown – including values from Used and Max.

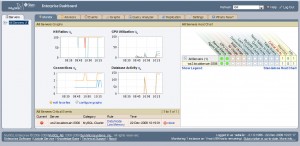
I then add more data to the database until the critical alert is raised and confirm that it’s displayed on the main monitoring panel of the MySQL Enterprise Monitor dashboard. Note that if you requested these alerts be included with the SNMP feed then SNMP traps will also be raised.
Please note that this example is intended to illustrate the mechanics of setting up monitoring on an arbitrary piece of data from ndbinfo and obviously in the real world you would want to monitor more than just the memory and even for the memory, you might want to use a more sophisticated rule.
