About 11 months ago I described the MySQL Cluster functionality that was added to MySQL Enterprise Monitor 2.3; this new post is intended to just bring this up to date – briefly describing the new graph and advisors which have been added since then (up to and including MEM 2.3.7).
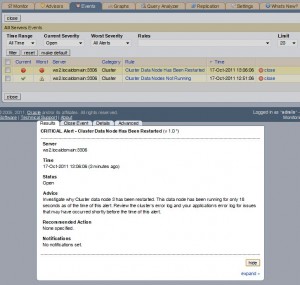
Cluster Data Node Has Been Restarted
This new alert flags when a data node has been restarted (by default it alerts on any data node that has started in the last 10 minutes but you can change that interval if you wish). If you manually perform a restart (e.g. as part of a rolling upgrade) then you can safely ignore this alert (or you may even want to temporarily unschedule it first). However if the restart was spontaneous then this can be an early warning for you to take a look at the error logs and address any issues before the situation worsens.
Cluster DiskPageBuffer Hit Ratio Is Low (& associated graph)
The Disk Page Buffer is a cache on each data node which is used when using disk-based tables. Like any cache, the higher the hit rate the better the performance. Tuning the size of this cache can have a significant effect on your system – the new graph helps you see the results of your changes and the alert warns you when the ration falls below an acceptable level (this could happen for example temporarily after a data node restart or permanently when the active data set grows).
The ndbinfo database has a new table “diskpagebuffer” which contains the raw information needed to calculate the cache hit ration and it is the source of the data for the new alert and graph. If you wanted to calculate the cache hit ratio for yourself directly from this table then you can use the following query:
|
1
2
3
4
|
<span style="color: #003366;">mysql> SELECT node_id, page_requests_direct_return AS hit, </span> <span style="color: #003366;"> page_requests_wait_io AS miss, 100*page_requests_direct_return/</span> <span style="color: #003366;"> (page_requests_direct_return+page_requests_wait_io) AS hit_rate FROM ndbinfo.diskpagebuffer;</span> |
|
1
2
3
4
5
6
7
|
<span style="color: #003366;"> +---------+------+------+----------+ | node_id | hit | miss | hit_rate | +---------+------+------+----------+ | 3 | 6 | 3 | 66.6667 | | 4 | 10 | 3 | 76.9231 | +---------+------+------+----------+</span> |
The alert is first raised (info level) when the hit rate falls bellow 97%, the warning level is raised at 90% and the critical level at 80%. Again, you can alter any of these thresholds.
The new graph simply displays how the hit rate varies over time so that you can spot trends.
As a reminder you can get more information on the original set of alerts and graphs here.