Filters
|
Query Analyzer: contains the
following default, system filters:
Administration Statements:
filters on statements of type
GRANT,
REVOKE,
RESET, SET,
SHOW, FLUSH,
CACHE, KILL,
and SHUTDOWN.
All Statements: (default) no
filtering defined. All statements are displayed.
DDL Statements: filters on
statements of type CREATE,
DROP, ALTER,
TRUNCATE, and
RENAME.
DML Statements: filters on
statements of type SELECT,
INSERT,
UPDATE,
DELETE,
REPLACE,
CALL, LOAD,
DO, and
HANDLER.
Prepared Statements: filters on
statements of type PREPARE,
EXECUTE, and
DEALLOCATE.
Replication Statements: filters
on statements of type START,
STOP, RESET,
and CHANGE
Statements with Errors: filters
on the advanced filter options of Total
Errors > 0.
Statements with Full Table Scans:
filters on the advanced filter options of
Table Scan notices and
Total Table Scans > 0.
Statements with Max Exec Time Over 1
Second: filters on the advanced filter
options of Max Exec Time > 1.
Statements with Temporary Tables:
filters on the advanced filter options of
Total Temporary Tables > 0.
Statements with Temporary Tables on
Disk: filters on the advanced filter
options of Total Temporary Disk Tables >
0
Statements with Warnings: filters
on the advanced filter options of Total
Warnings > 0
Table Maintenance Statements:
filters on statements of type
OPTIMIZE,
ANALYZE,
CHECK,
REPAIR, and
CHECKSUM.
Transactional and Locking
Statements: filters on statements of type
BEGIN,
COMMIT,
ROLLBACK,
SAVEPOINT,
RELEASE,
LOCK, and
UNLOCK.
Customized versions of the system filters are created
using the name of the filter with a
-clone suffix.
|
Statements
|
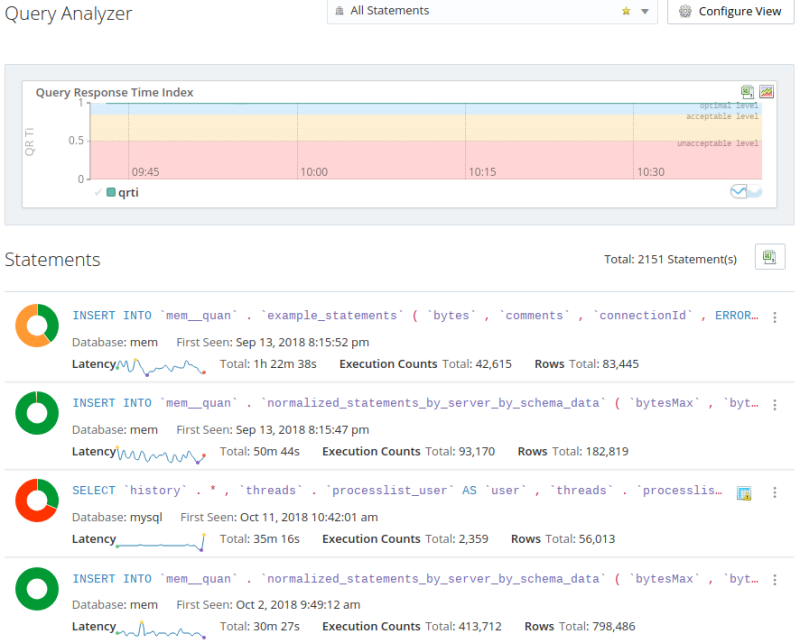
The statements panel displays the statement data. The data
displayed is configured in the Data
View section of the Configuration
View.
For more information, see
Data View.
By default, the Statements view displays the following:
QRTi pie chart: visual
representation of the Query Response Time index. Hover
the cursor over the pie chart to see a summary of the
Optimal,
Acceptable, and
Unacceptable QRTi percentages.
Query: displays the normalized
query. Hover the cursor over the statement to see the
full version. Or click the query to open the
Details page.
Database: the name of the
database on which the query was executed.
First Seen: the time and data at
which this query was first seen on the database.
Latency: sparkline graph
displaying the latency of the query. Hover the cursor
over the graph to display a tooltip containing the
summary of the latency.
Total: total amount of time spent
on this query.
Execution Counts: number of times
this query was executed.
Rows: number of rows affected by
this query.
All elements of the statement view are configurable,
except for the statement itself, which is always
displayed. To display the full statement, hover the cursor
over the statement line. The full statement is displayed
in a pop-up. To view the details of the statement, click
the statement, or the more options button on the right of
the statement's panel.
For more information on the Details
page, see Section 32.4, “Detailed Query Information”.
|
