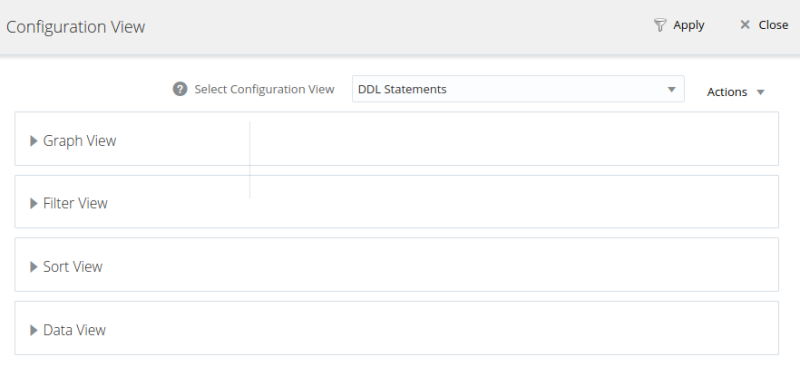
The Configuration View enables you to customize the data displayed on the Query Analyzer view.
Enables you to select the graphs displayed on the Query Analyzer view and the time range of the selected graphs.
To select a time range for the graphs, select a value from the Zoom section. Possible values range from one hour to two days.
To select one or more graphs to display on the Query Analyzer view, click in the Graph selection box and select the required graphs from the available options.
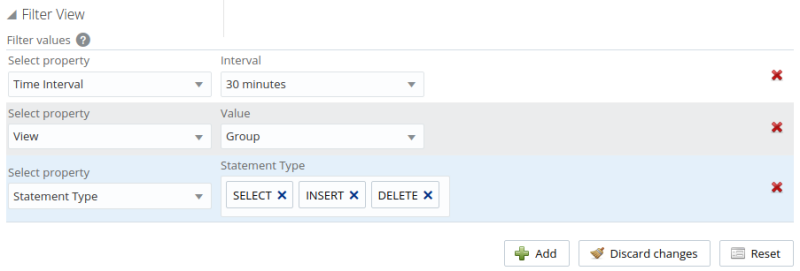
The following are the possible filter options:
Column: enables you to filter the queries based on specific values within any of the columns shown in the Query Analyzer report list.
To use the column filters, you must specify the Column that you want to filter on, the Operator to use when performing the comparison and the Value that you want to compare.
For example, to filter on all queries that return more than 100 rows on average, set the Column to
Average Rows, the Operator to>=, and the Value to 100.Database: limits the queries to those executed within a specific database. The database match is performed using the
LIKEmatch from the MySQL database, hence you can use the%and_characters to multiple and single character matches. For more information, see Pattern Matching.Notices: Filters on the notices, enabling you to filter the list to show only the queries that did not raise a notice, indicated a full table scan, or indicated that a bad index was used.
Statement Text and Value support text searching of the normalized query. For the search type you can specify either a basic text match (Contains), or a regular expression match (Regex). In addition to the basic text match, you can also search for a query that does not contain a particular string. For regular expression searches, you can specify whether the regular expression should match, or not match (negative regexp) the queries. Regular expressions are parsed using the standard MySQL
REGEXP()function. For more information, see Regular Expressions.NoteThe search is performed against the canonical version of the query. You cannot search against specific text or values within the parameters of the query itself.
Statement Type: Limits the search to statements of a particular type (
SELECT,LITERAL, etc.).The Time From/To: enables you to select a time range for filtering. Only queries executed within the displayed time period are displayed, using the Hours and Minutes pop-up), or whether the selection should be based on a time period (From/To).
Using this property you can display only the queries executed during a specific time span, and you can display the query history for a much longer time period, for as long as you have been recording query analysis information.
NoteIt is not possible to use both Time Interval and Time From\To together. You must use one or the other.
Time Interval: filters queries within the given time period from the point the graph was updated. For example, if you select 30 minutes, the queries displayed are those captured within the last 30 minutes. If you updated the display at 14:00, the queries displayed are those captured between 13:30 and 14:00. Possible values are between 15 minutes and 2 years.
NoteIt is not possible to use both Time Interval and Time From\To together. You must use one or the other.
View: determines whether the information should be returned on a Group basis, where an aggregate of the same query executed on all monitored servers is shown, or on a Server basis, where queries are summarized by individual server. If the latter option is selected, the statements can be expanded to list the individual servers on which they were executed.
The Sort view enables you to specify how the data is ordered in the Statements view.
Database: The default database in use at the time of the query. The database name might be blank, or might not match the database used within the query, if you used a qualified table name (for example,
select ... from db_name.table_name) or if you issued aUSEstatement to switch databases after connecting.Errors: Highlights any specific issues experienced when running queries, including excessive table scans and bad index usage. These provide an immediate indication of a problem with a query that might require additional examination.
Execution Counts: The number of times that the query has been executed.
First Seen: The date and time the normalized version of this query was first seen, which might be earlier than the period specified by the filter.
Instance: the name of the MySQL instance.
Latency: The execution time for all the matching queries. This is the time, for every invocation of the corresponding query, as calculated by comparing the time when the query was submitted and when the results were returned by the server. Times are expressed in HH:MM:SS.MS (hours, minutes, seconds, and milliseconds).
Latency is subdivided into the following groupings:
Latency Total: the cumulative execution time for all the executions of this query.
Latency Maximum: the maximum execution time for an execution of this query.
Latency Average: the average execution time for the execution of this query.
Locks: the time spent waiting for table locks caused by the query.
Average History graph (Avg History): graphs the average execution time.
No Good Index Used:
No Index Used:
Rows: The rows returned by the query. This is sub-divided into the following groupings:
Rows Total: The sum total number of rows returned by all executions of the query.
Rows Average: The average number of rows returned by all executions of the query.
Rows Examined: The average number of rows returned by all executions of the query.
Select Type
Select Type Full Join: number of joins performing table scans because they do not use indexes.
Select Type Full Range Join: the number of joins using a range search on a reference table.
Select Type Range: the number of joins using ranges on the first table.
Select Type Range Check: the number of joins without keys that check for key usage after each row.
Select Type Scan: the number of joins performing a full scan of the first table.
Sorting
Sorting Merge Passes: the number of merge passes the sort algorithm has performed.
Sorting Range: the number of sorts performed using ranges.
Sorting Rows: the number of sorted rows.
Sorting Scan: the number of sorts performed by scanning the table.
Statement: The normalized version of the query. Normalization removes the query-specific data so that different queries with different data parameters are identified as the same basic query.
The information is shown as one query per row. Each query row is expandable, and can be expanded to show the execution times for individual servers for that query.
NoteIf the selected context is a cluster, the queries for the cluster's SQL nodes are displayed either for the specific node or for the cluster as an aggregate. If other node types are selected, the aggregate is displayed.
Temporary Tables
Temporary Tables Average: the average number of internal temporary tables created per occurrence of the statement.
Temporary Tables Disk: the total number of internal, on-disk temporary tables created by occurrences of the statement.
Temporary Tables Disk % : the percentage of internal in-memory temporary tables that were converted to on-disk tables.
Temporary Tables Total: the total number of internal in-memory temporary tables created by occurrences of the statement
Time: the time at which the statements were executed.
Warnings: the number of warnings generated by a statement.
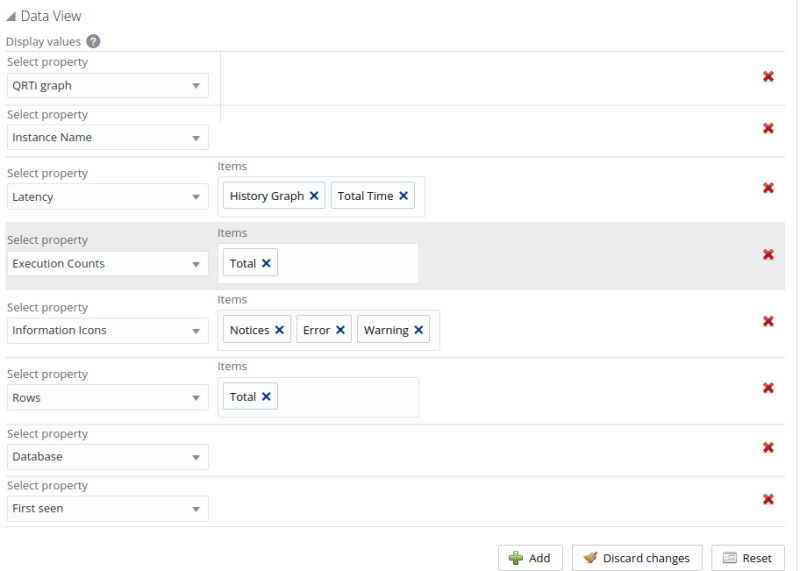
The Data View configures the elements displayed in the entries of the Statement view.
The possible properties are as follows:
Database: the name of the database on which the statement was executed.
Execution Counts: the number of times the statement was executed.
First Seen: the time and date the statement was first seen.
Information Icons: select which information icons you want displayed on the statement view. These icons are displayed on the right-hand side of the statement. Possible choices are: Notices. Errors, or Warnings.
Instance Name: the name of the MySQL instance.
Latency: the execution times for the statements. The following latency settings are possible:
History Graph: adds a latency graph to the statement data. This graphs the latency high, low, and average history.
Total Time: the total time taken by all executions of this statement.
Maximum Time: the maximum time taken for an execution of this statement.
Average Time: the average execution time for this statement.
Lock Time: the time spent waiting for table locks caused by this statement.
QRTi Graph: adds a Query Response Time index pie-chart to the left side of the statement. The pie-chart graphs the Optimal, Acceptable, and Unacceptable percentages for the statement.
Rows: the number of rows returned. The following are the possible values:
Total: the sum total of rows returned by executions of this statement.
Examined: the total number of rows read by this statement.
Average: the average number of rows returned by this statement.
Select Type: the following are the possible values:
Full Join: the number of joins performing table scans because they do not use indexes.
Full Range: the number of joins using a range search on a reference table.
Range: the number of joins using ranges on the first table.
Range Check: the number of joins without keys that check for key usage after each row.
Scan: the number of joins performing a full scan of the first table.
Sorting: the following are the possible values:
Merge Passes: the number of merge passes the sort algorithm has performed.
Range: the number of sorts performed using ranges.
Rows: the number of sorted rows.
Scan: the number of sorts performed by scanning the table.
Temporary Tables: the following values are possible:
Average: the average number of internal temporary tables created per occurrence of the statement.
Disk: the total number of internal, on-disk temporary tables created by occurrences of the statement.
Disk % : the percentage of internal in-memory temporary tables that were converted to on-disk tables.
Total: the total number of internal in-memory temporary tables created by occurrences of the statement
Filters can be created, or existing filters customized, in the Query Analyzer Configuration View.
To create a user filter, you can either create a filter and save it by clicking Save as... menu item, or create a new filter by clicking New, defining your filter criteria, and clicking Save as....
You can also create a filter by using an existing filter as a template. Select the filter and make your changes. If you create a named filter based on an existing filter, the -clone is appended to the name when you edit the new filter. The name can be edited as required.
System filters are listed with a padlock on the left side of their name. These cannot be edited, but can be used as templates for new filters.
To set a filter as the default, select it in the drop-down list, and select Set as Default from the adjacent drop-down menu. A star is displayed next to the default filter.
If you upgraded from a previous version, and used default
filters in that version, your filters are migrated and renamed
User Default.


