MySQL Workbench Release Notes
View server performance statistics in a graphical dashboard. To display the dashboard, open a query tab and then click Dashboard from the Performance area of the Navigator sidebar with the Management tab selected. The following figure shows the layout of the information within the Administration - Dashboard tab.
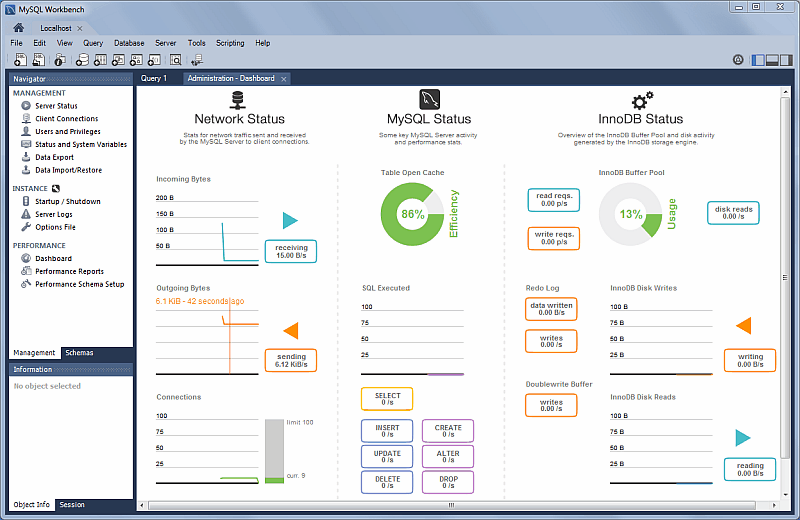
This highlights statistics for network traffic sent and received by the MySQL server over client connections. Data points include the Incoming Network Traffic, Outgoing Network Traffic, and Client Connections.
This highlights the primary MySQL server activity and performance statistics. Data points include the Table Open Cache efficiency, SQL Statements Executed, and counts (per second) for SELECT, INSERT, UPDATE, DELETE, CREATE, ALTER, and DROP statements.
This provides an overview of the InnoDB Buffer Pool and disk activity that is generated by the InnoDB storage engine. Data points are separated into three groups:
Note
Hover over a graph to see additional information, such as a total count.
-
Usage
Read Requests: The number of logical read requests (per second) InnoDB has performed to the buffer pool.
Write Requests: The number of logical write requests (per second) InnoDB has performed to the buffer pool.
Disk Reads: The number of logical reads that InnoDB could not satisfy from the buffer pool. As a result, these had to be read from the disk.
InnoDB Buffer Pool Usage: The percentage of the InnoDB buffer pool that is in use. Hover over the graphic to see additional information, such as Usage Rate and Pages Free.
-
Writes
Data Written: The number of writes written to the InnoDB redo log file.
Writes: The number of physical writes written to the InnoDB redo log file.
InnoDB Disk Writes: Hover over this dynamic graph to see the number of disk writes over a specific second. The available range includes the last 120 seconds.
Writing: Total amount of data (in bytes) written using file operations by the InnoDB storage engine.
-
Reads
Doublewrite Buffer Writes: The number of doublewrite operations that were performed.
InnoDB Disk Reads: Hover over this dynamic graph to see the number of disk reads over a specific second. The available range includes the last 120 seconds.
Reading: Total amount of data (in bytes) read in file operations by the InnoDB storage engine.